Should we use MRP
for simulating area-level outcomes?
– Roger Beecham
– Stephen Clark
Small area estimation

Small area estimation
Small area estimation
– direct estimation
Small area estimation
– direct estimation
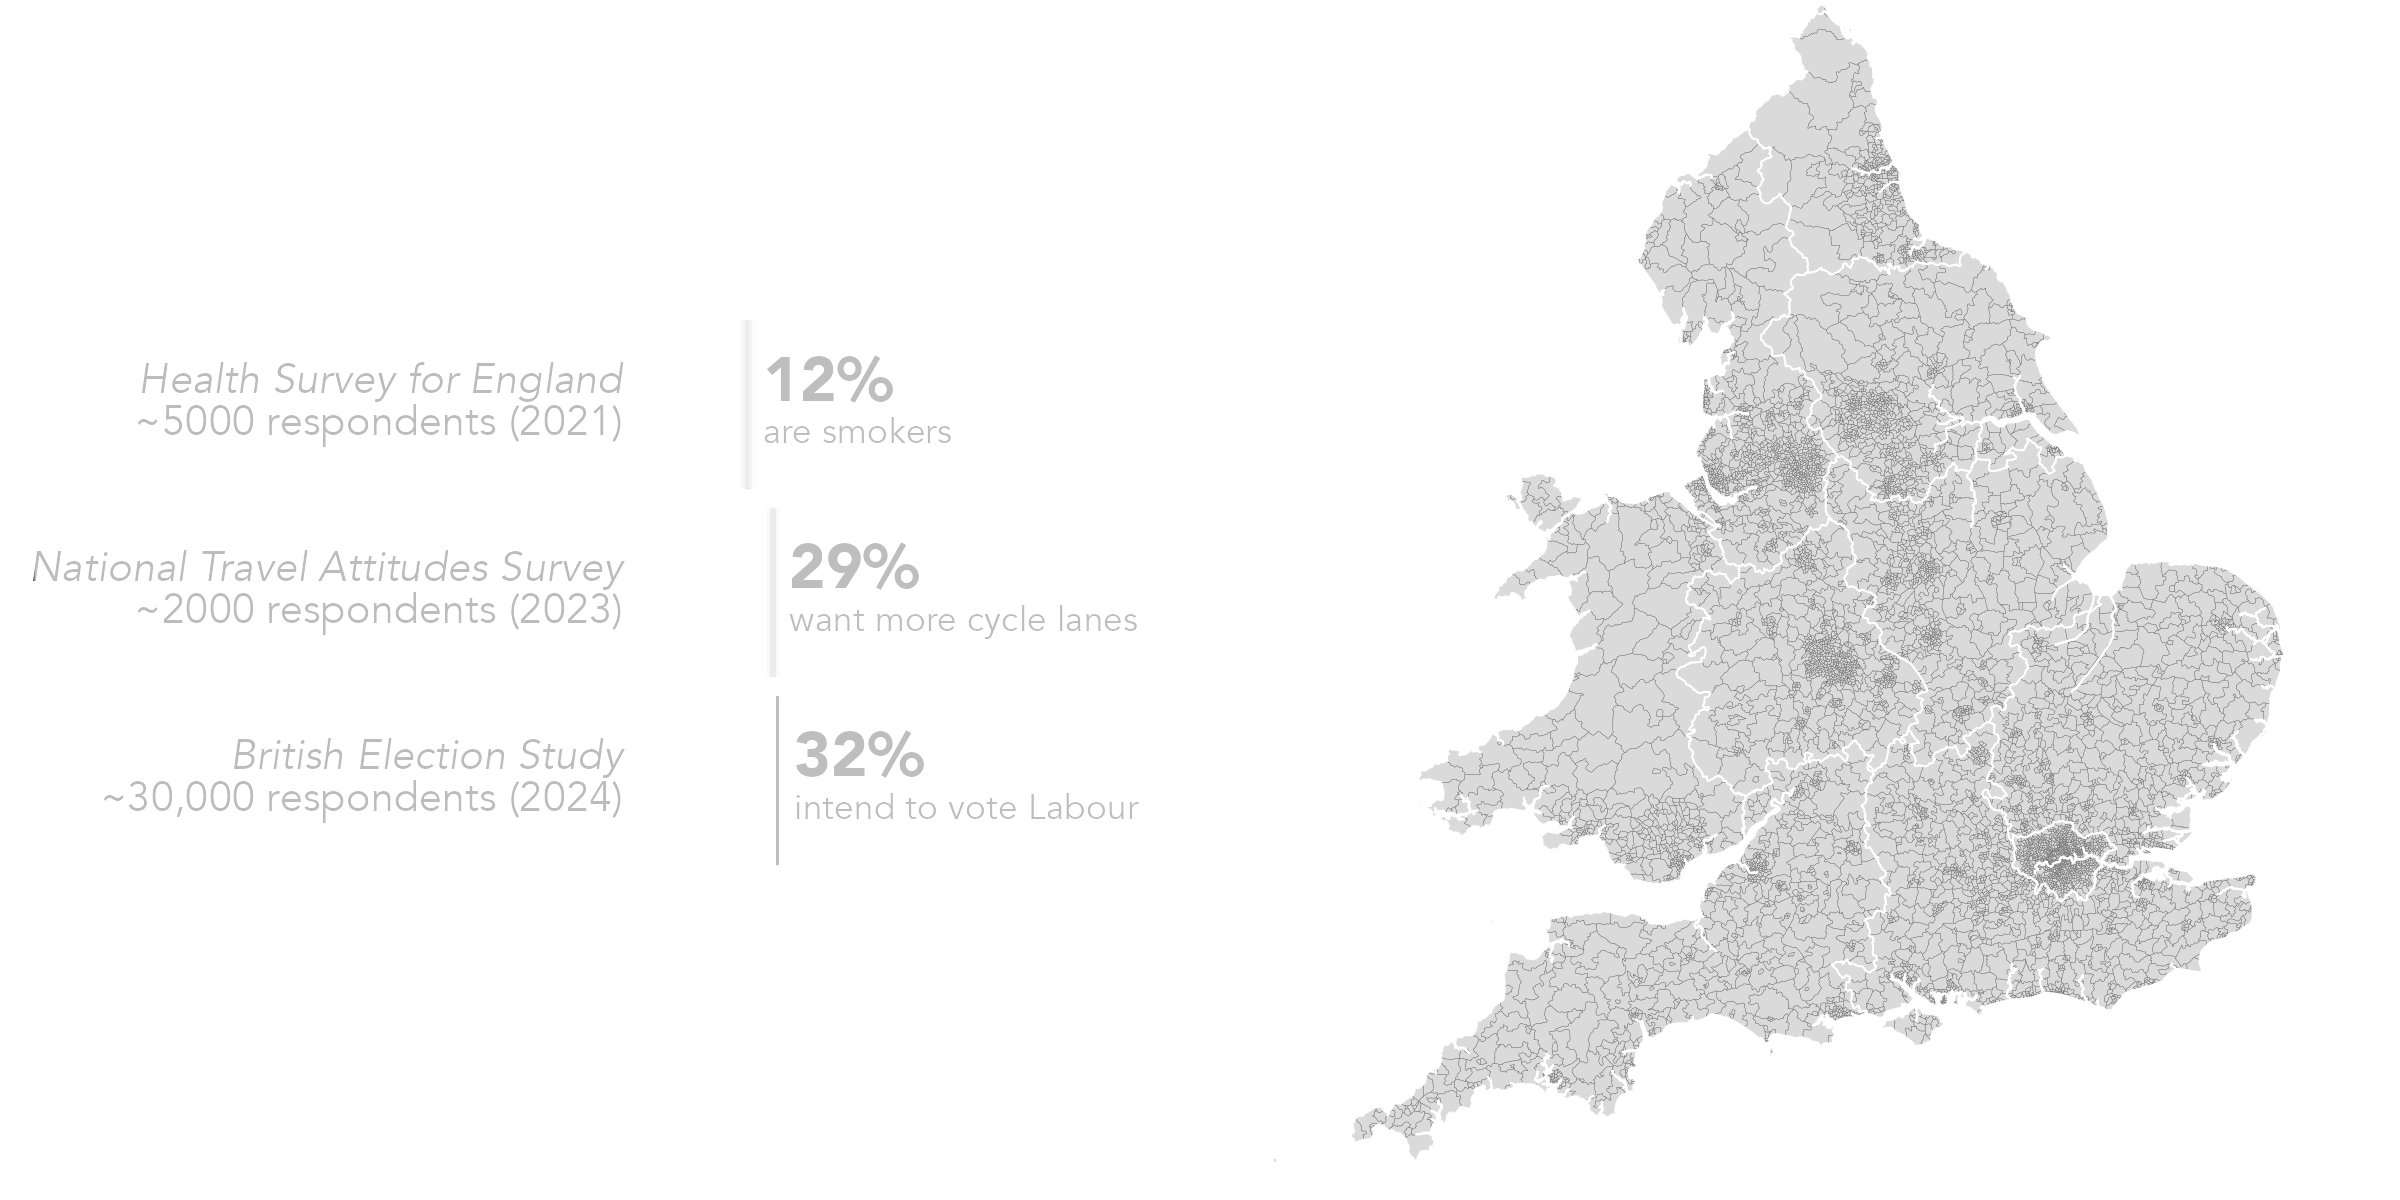
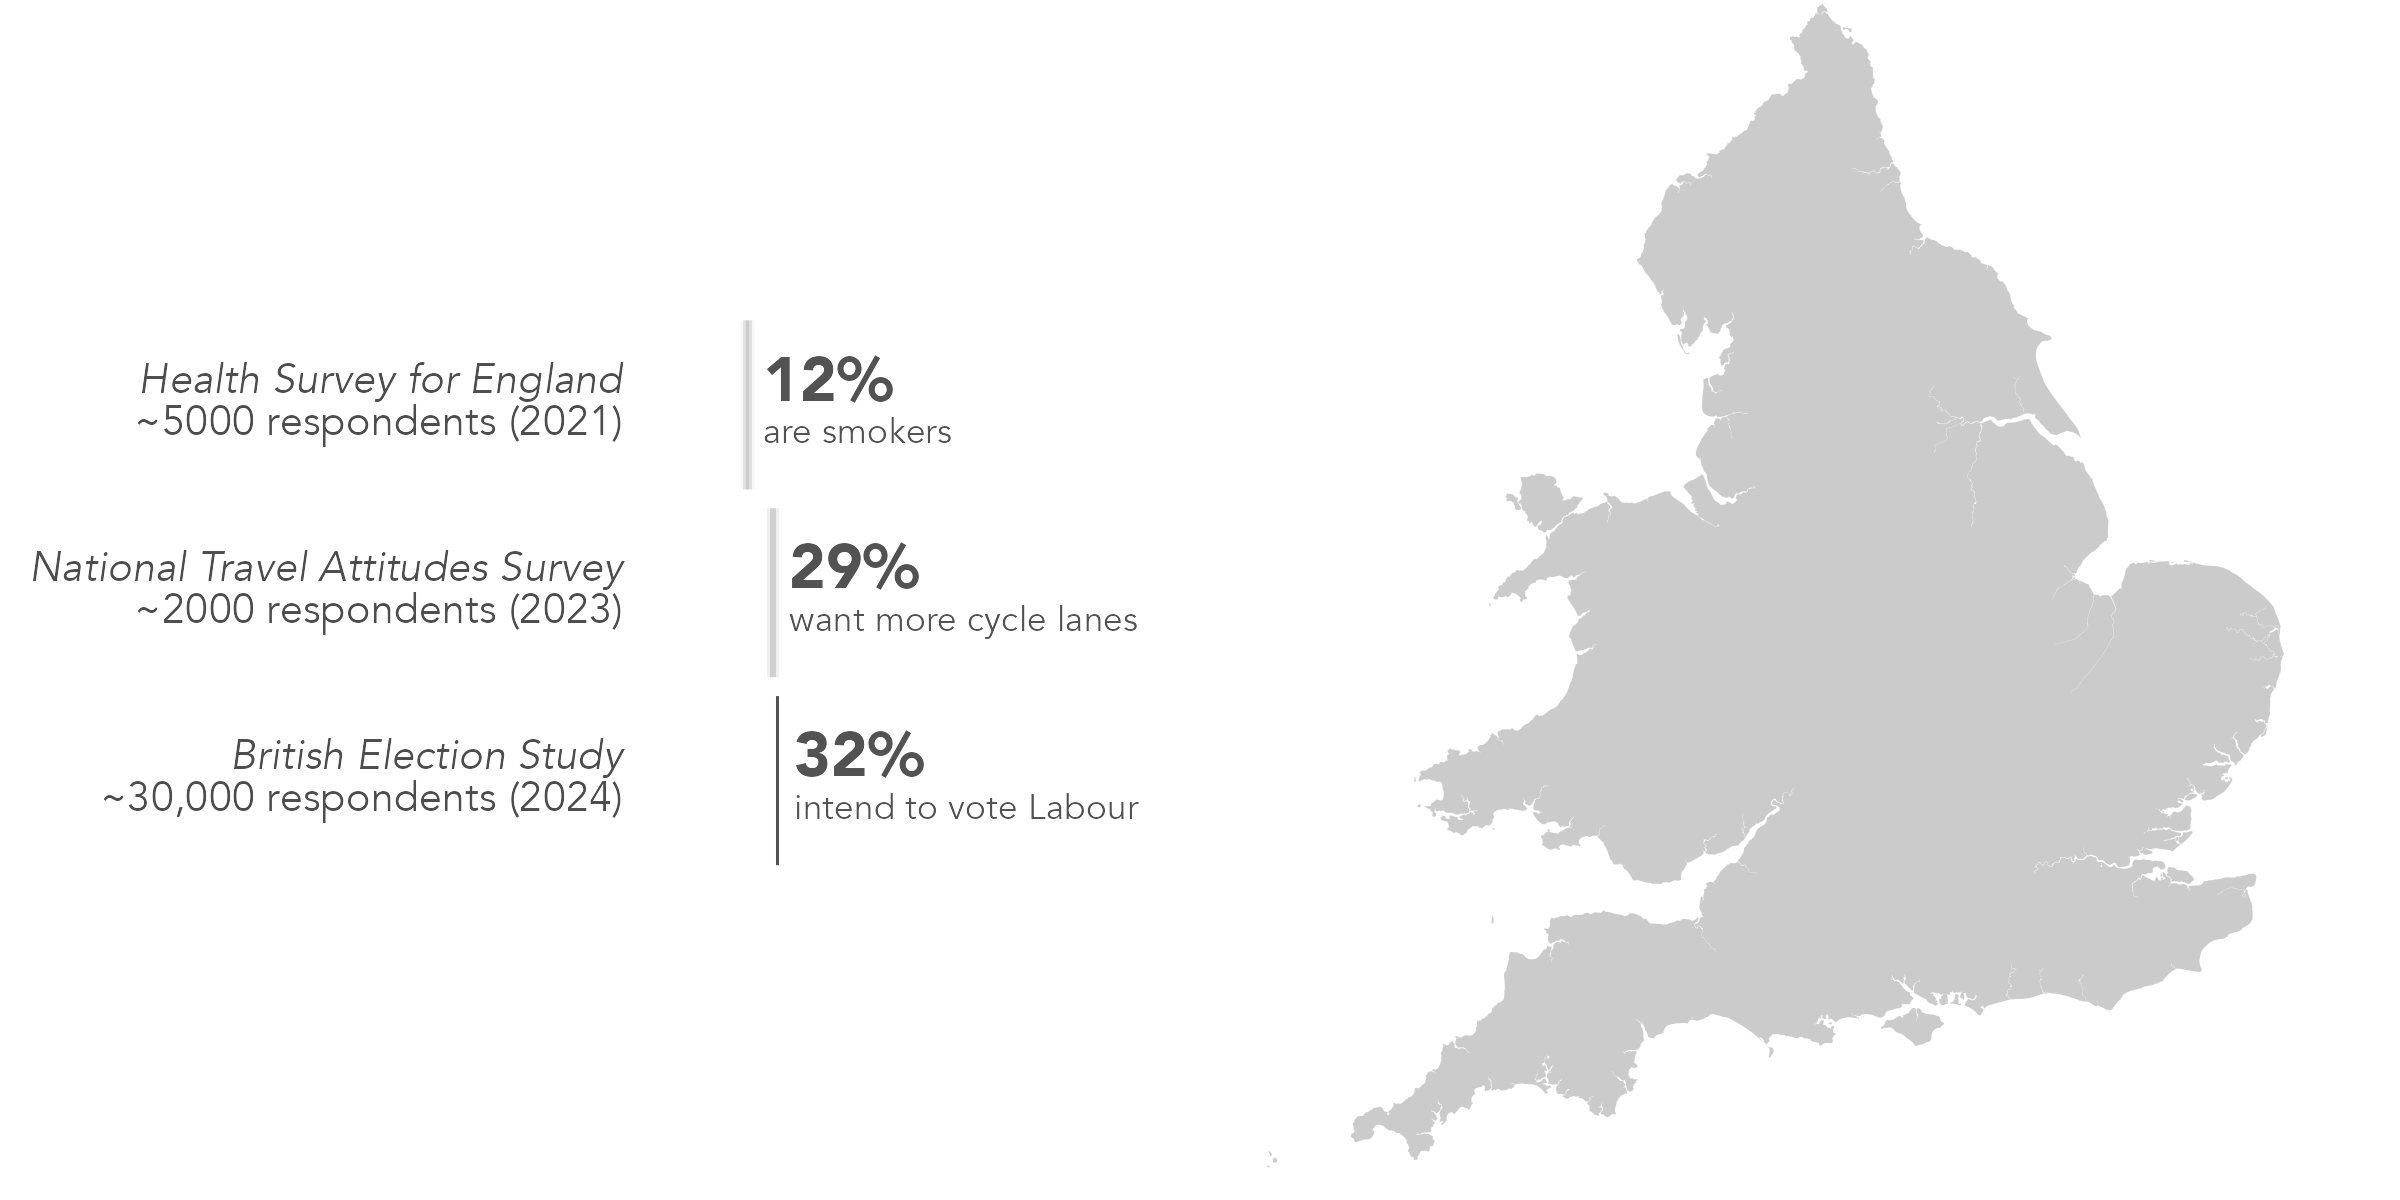
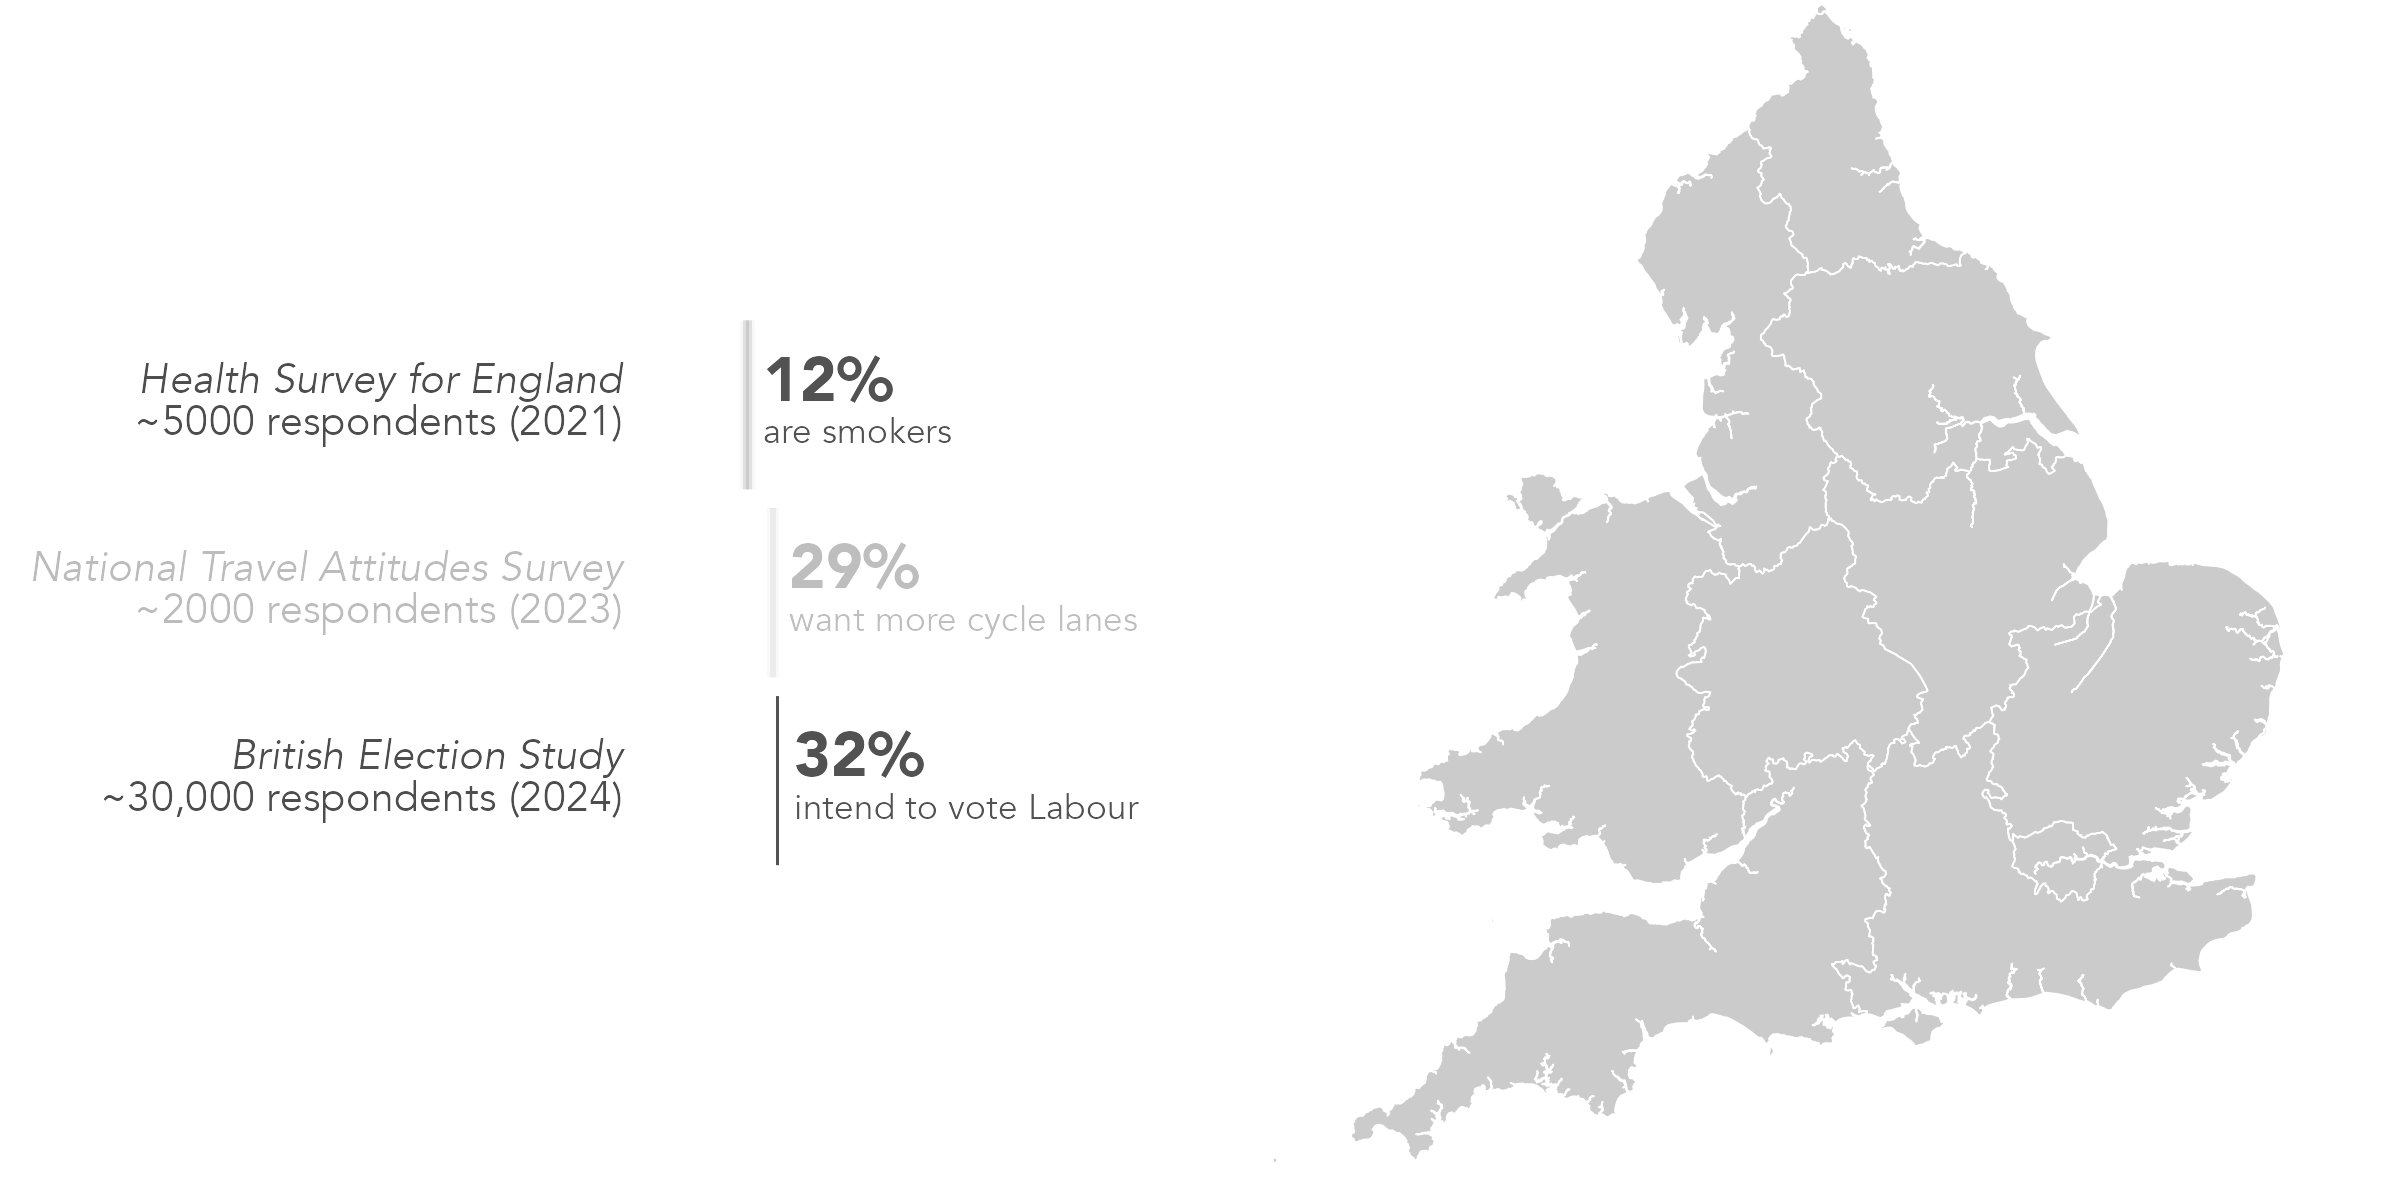
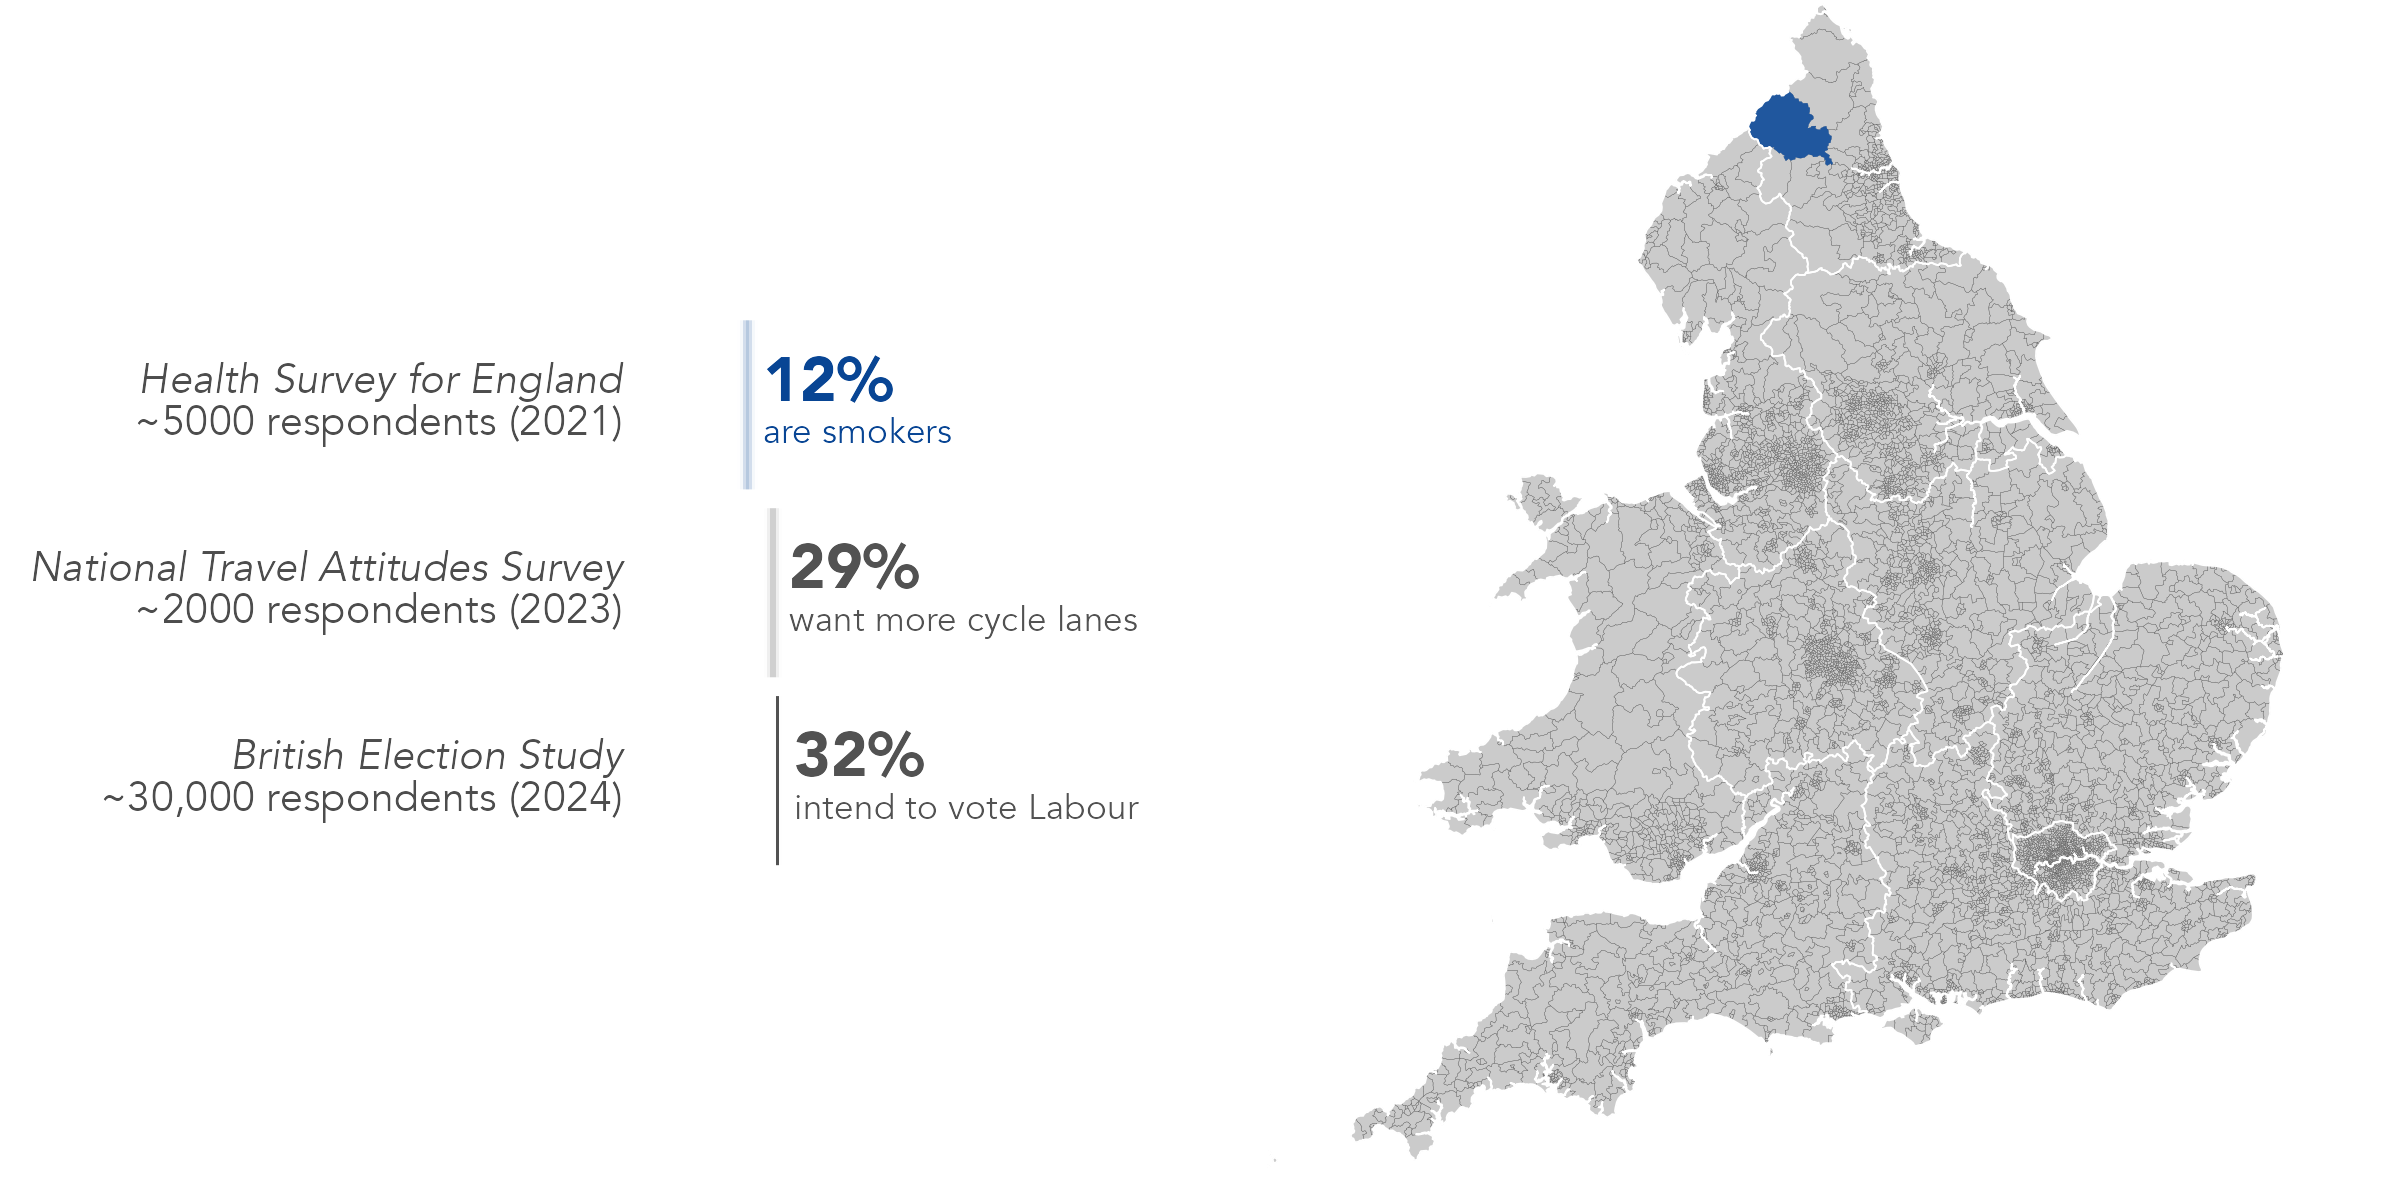
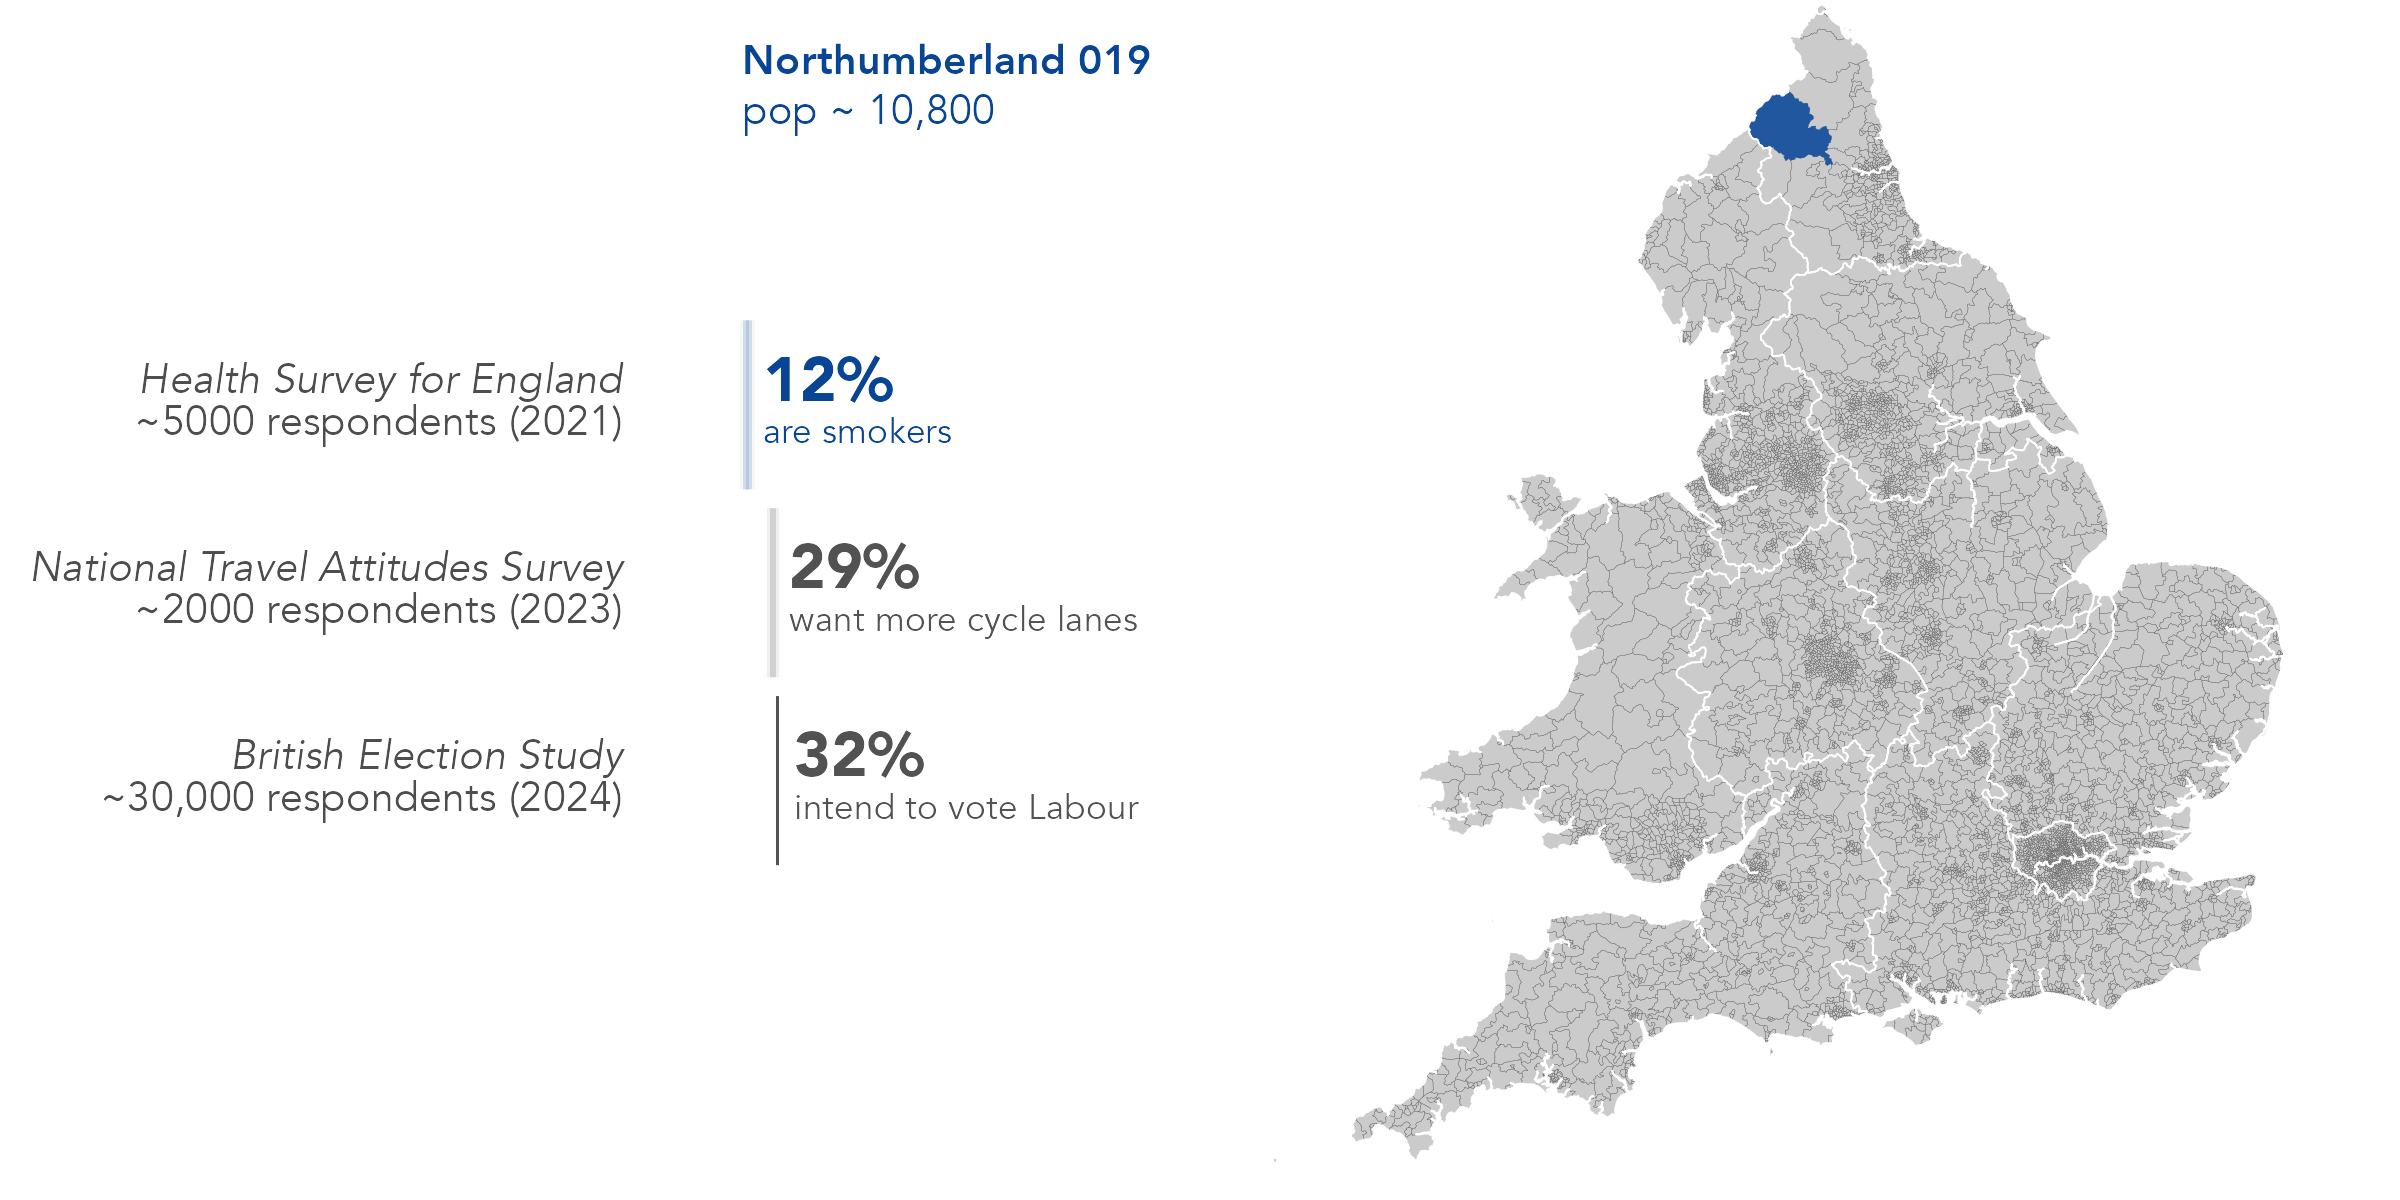
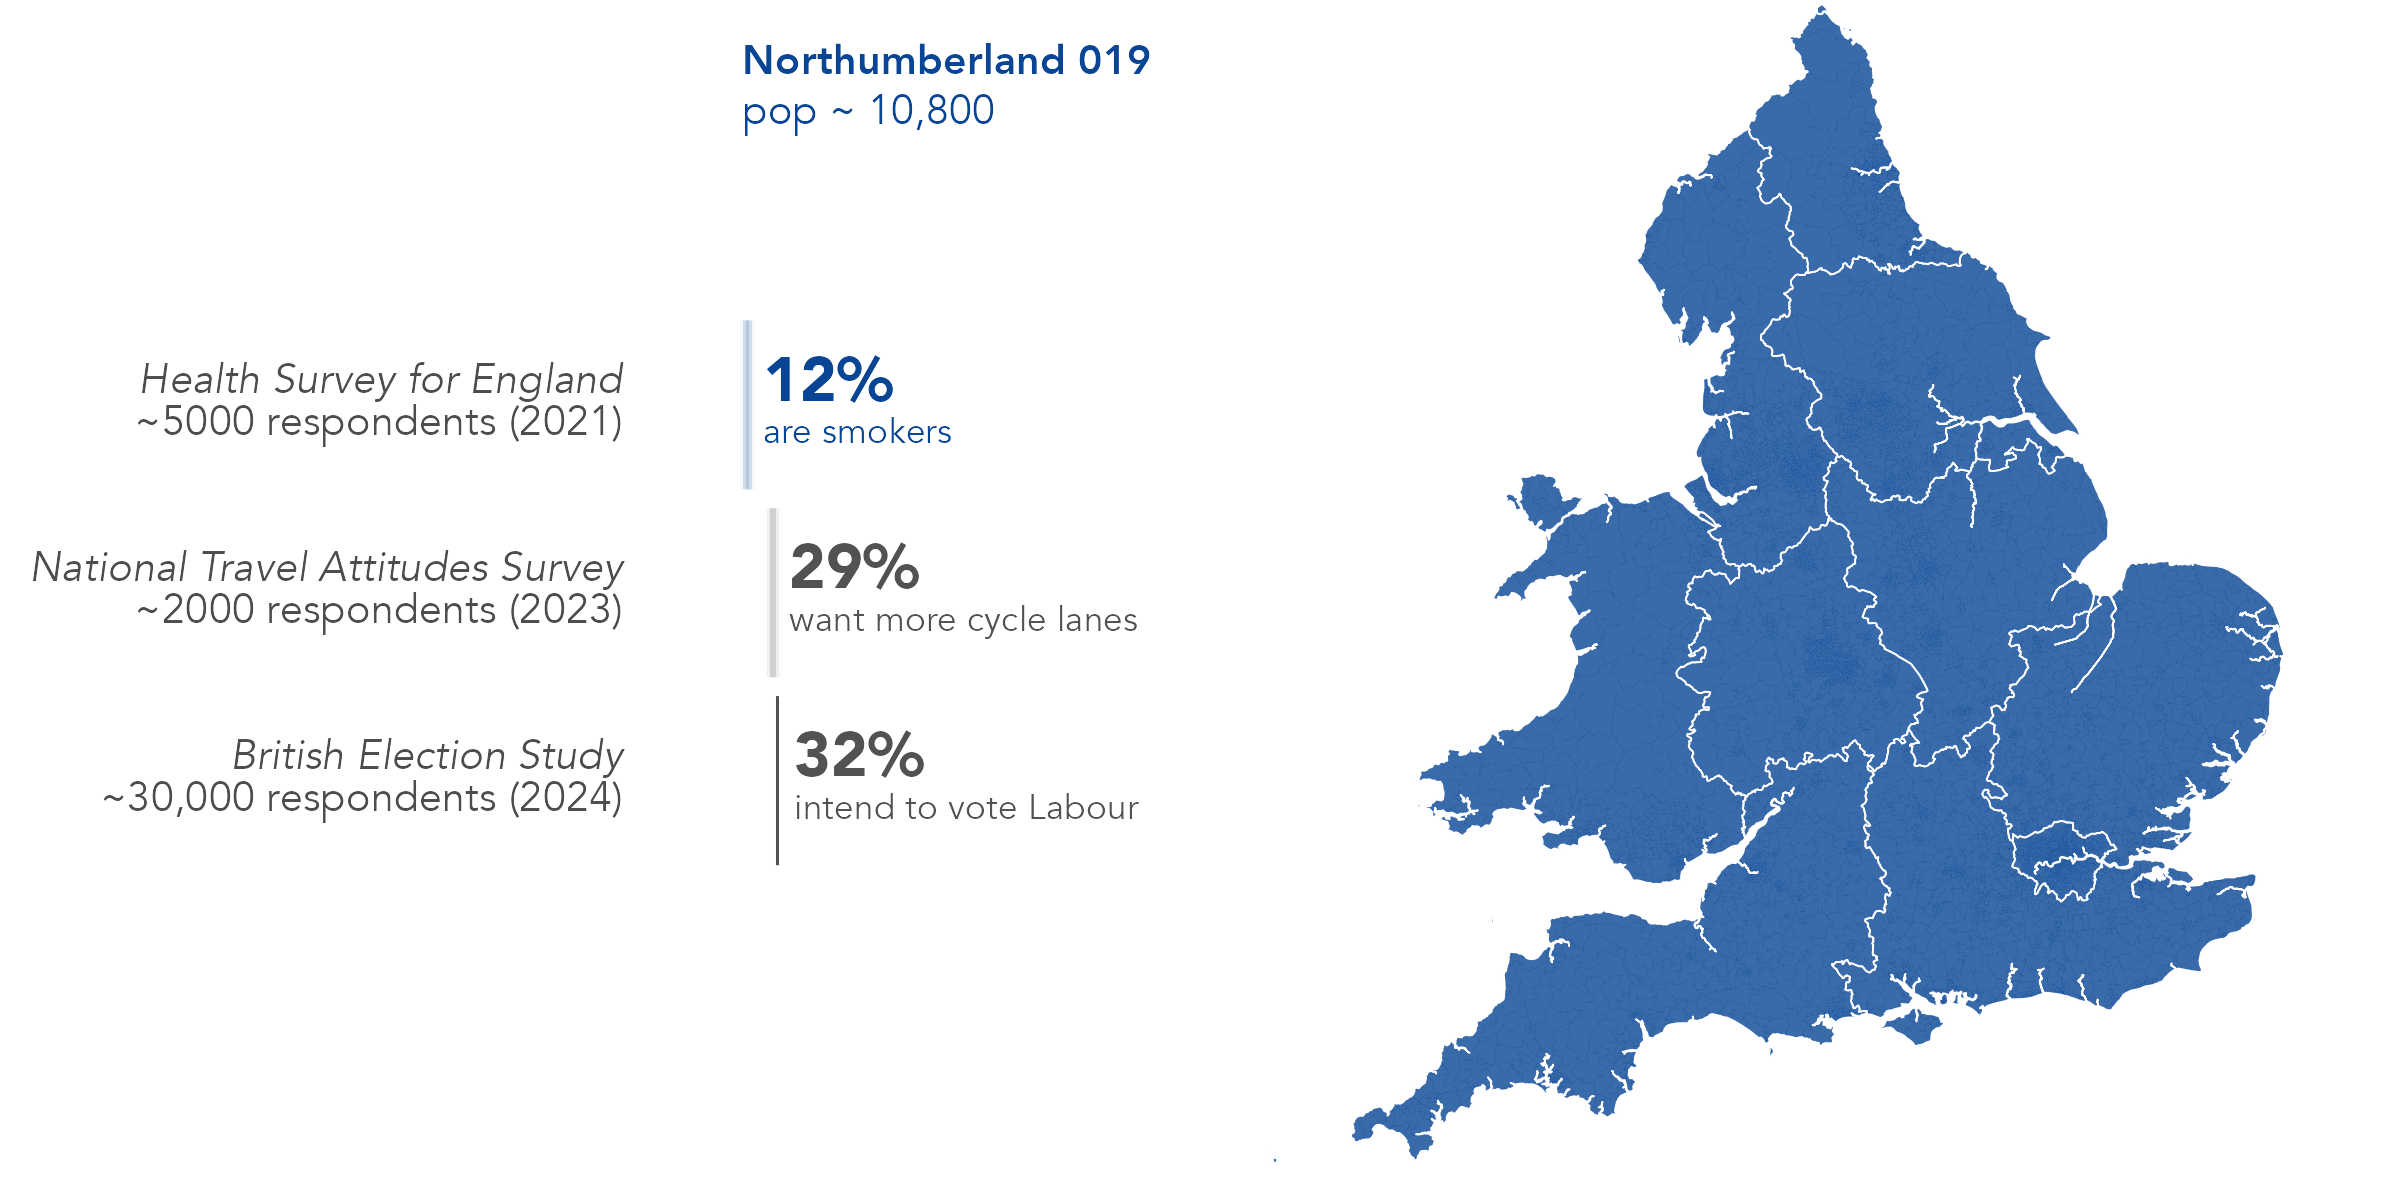
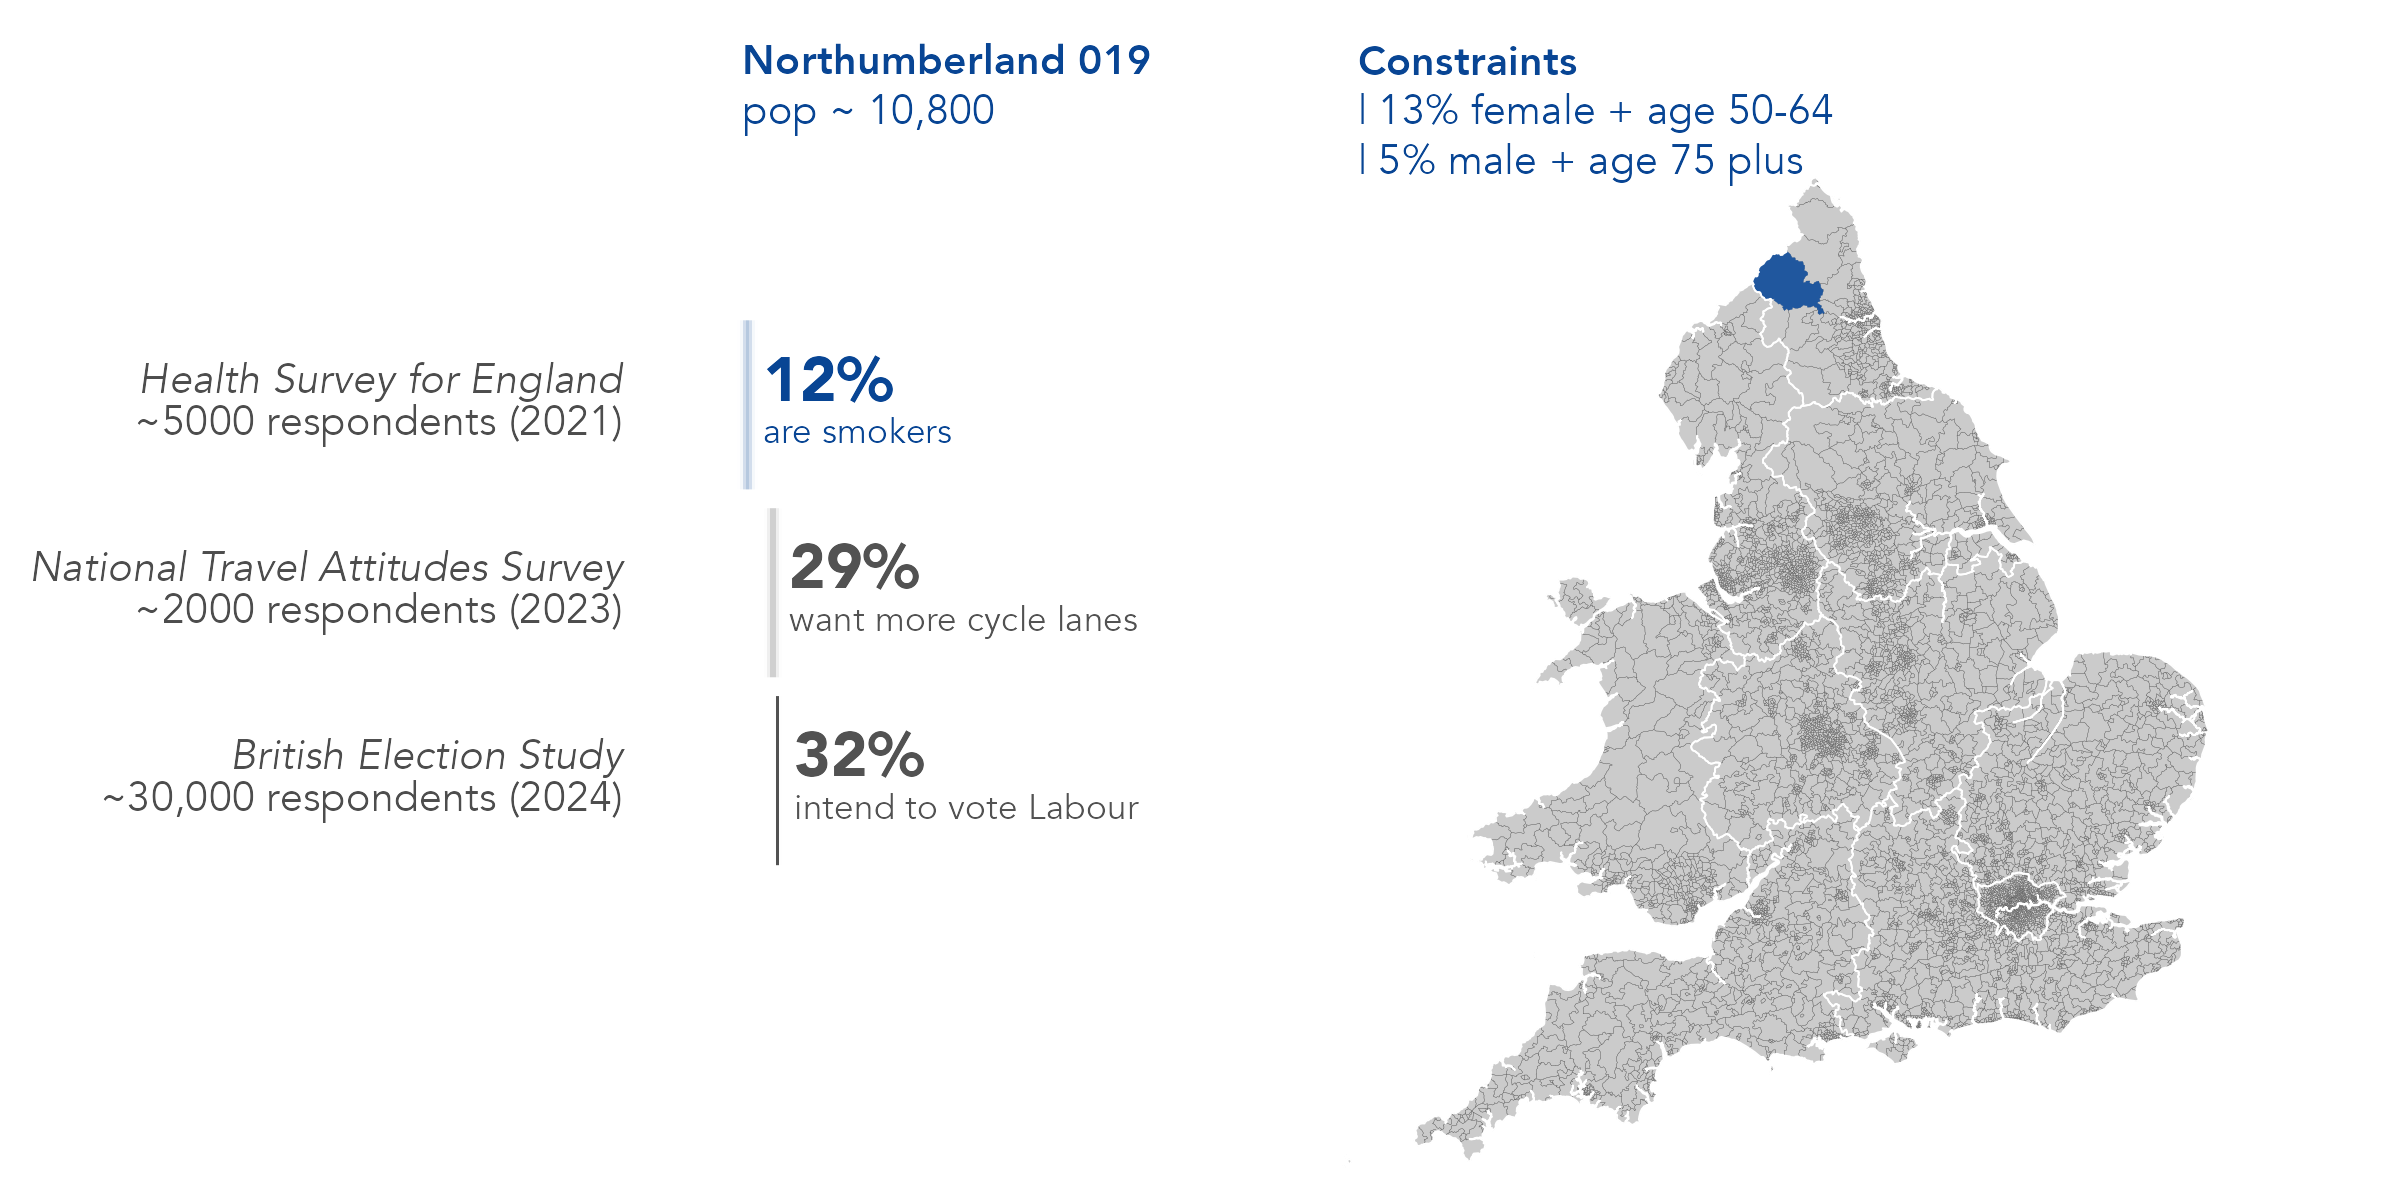
Small are estimation is where we use survey data to estimate an unknown outcome – smoking, beliefs about cycling, voting intention – for subpopulations (small areas) where sample sizes are too small for direct estimation.
Spatial microsimulation
Spatial microsimulation
Spatial microsimulation
Spatial microsimulation
Spatial microsimulation assumptions
Survey data are sufficiently large and rich to be reproduce the diversity of individuals in a small area.
The target / outcome being simulated is associated with the constraint variables.
That this association is stable and geographically uniform.

Andrew Gelman and Thomas Little (1997)
Poststratification into many categories using hierarchical logistic regression
Survey Methodology, 23(2): 127–135
Andrew Gelman and Thomas Little (1997)
Poststratification into many categories using
hierarchical logistic regression
Survey Methodology, 23(2): 127–135
A key attribute of MRP is that it allows predictions of y [an outcome] given values of x [constraints] that are not observed in the sample, or which have such small counts in the sample that it would be impossible to make predictions for them from local data alone.
Survey ~7,000 respondents

~Population

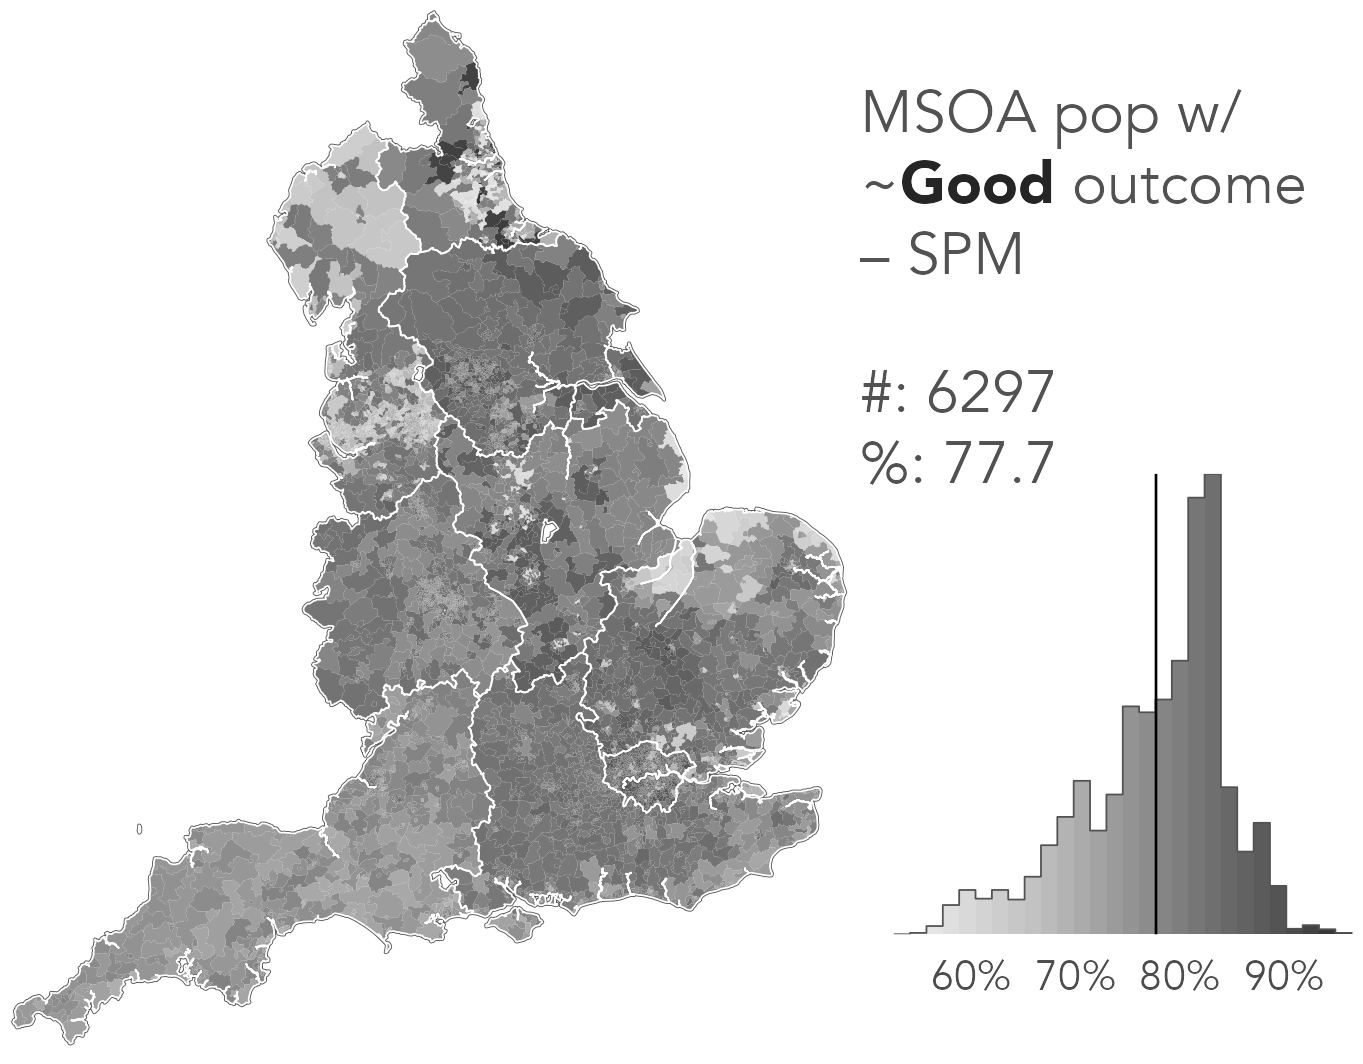
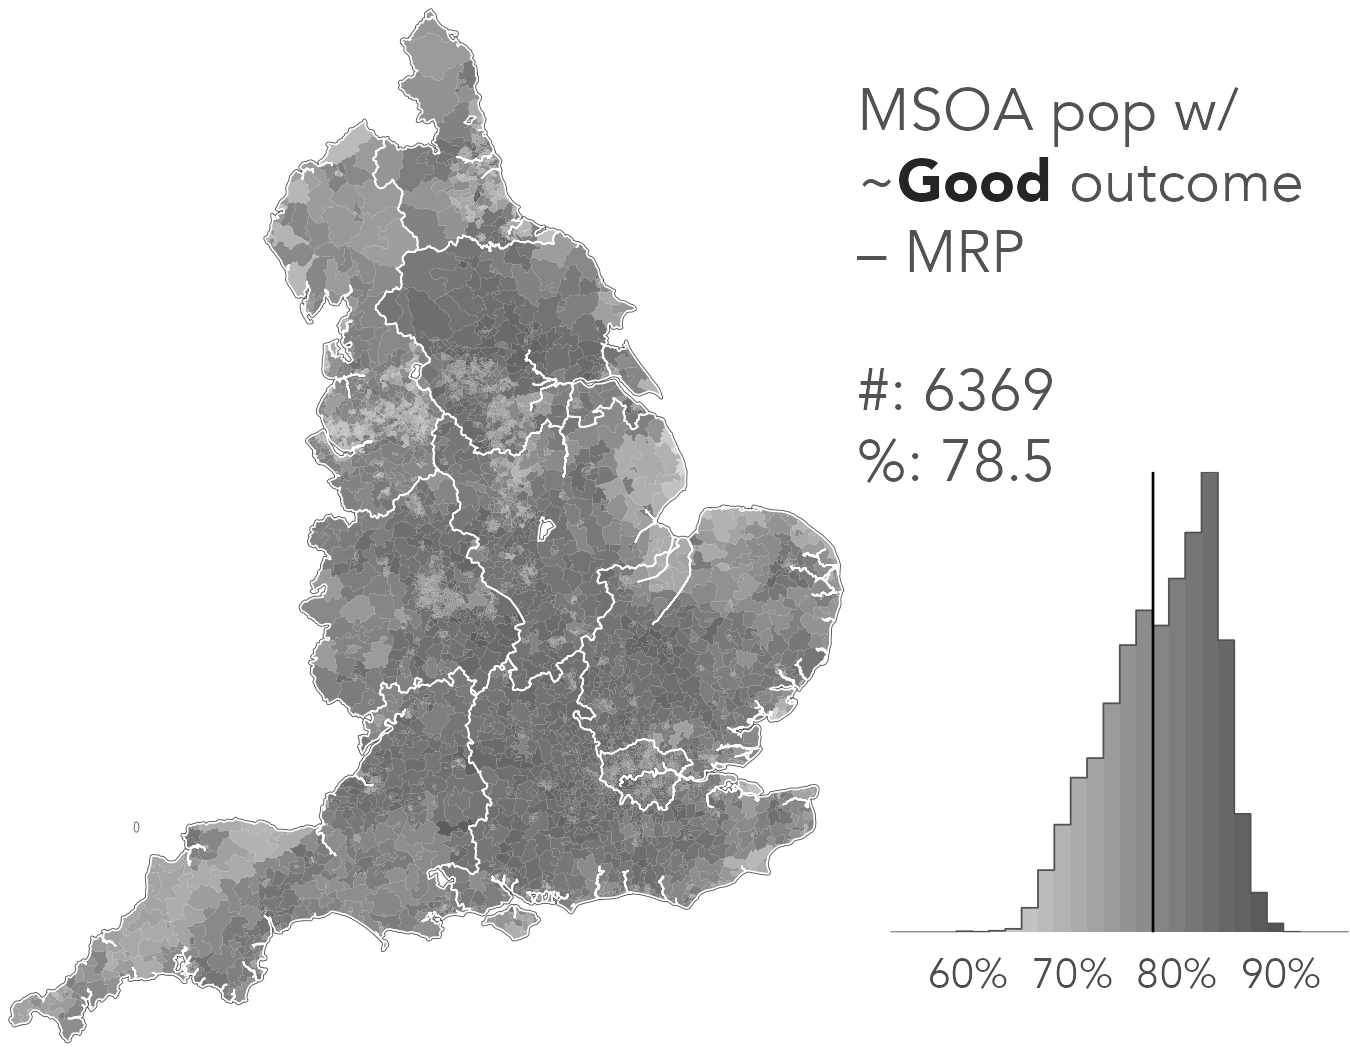
Target outcome
How is your health in general?
1. Very good
2. Good
3. Fair
4. Bad
5. Very Bad
Survey ~7,000 respondents
~Population
Target Known outcome
How is your health in general?
1. Very good
2. Good
3. Fair
4. Bad
5. Very Bad
Survey ~7,000 respondents
~Population
Target Known outcome
How is your health in general?
1. Very good
2. Good
3. Fair
4. Bad
5. Very Bad
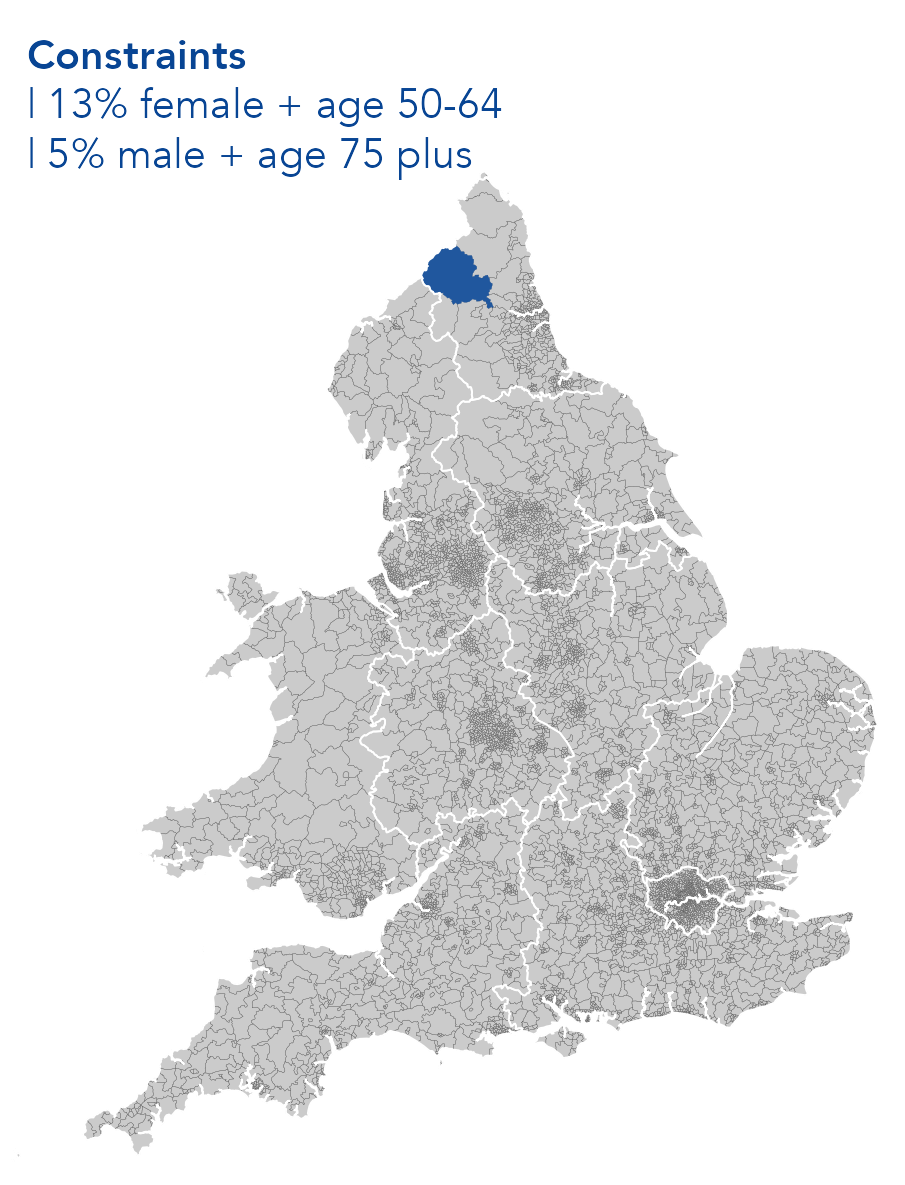
- demographic types
- sex {F | M}
- age {0-15 | 16-24 | 25-34 | 35-49 | 50-64 | 65+}
- education {level0 | level1/2 | level3 | level4}
- area-level context
- imd {1 most deprived | 2 | 3 | 4 | 5 least deprived}
- region {EM | E | Ldn | NE | SE | SW | WM | Y&H}
- rurality {urban | rural}
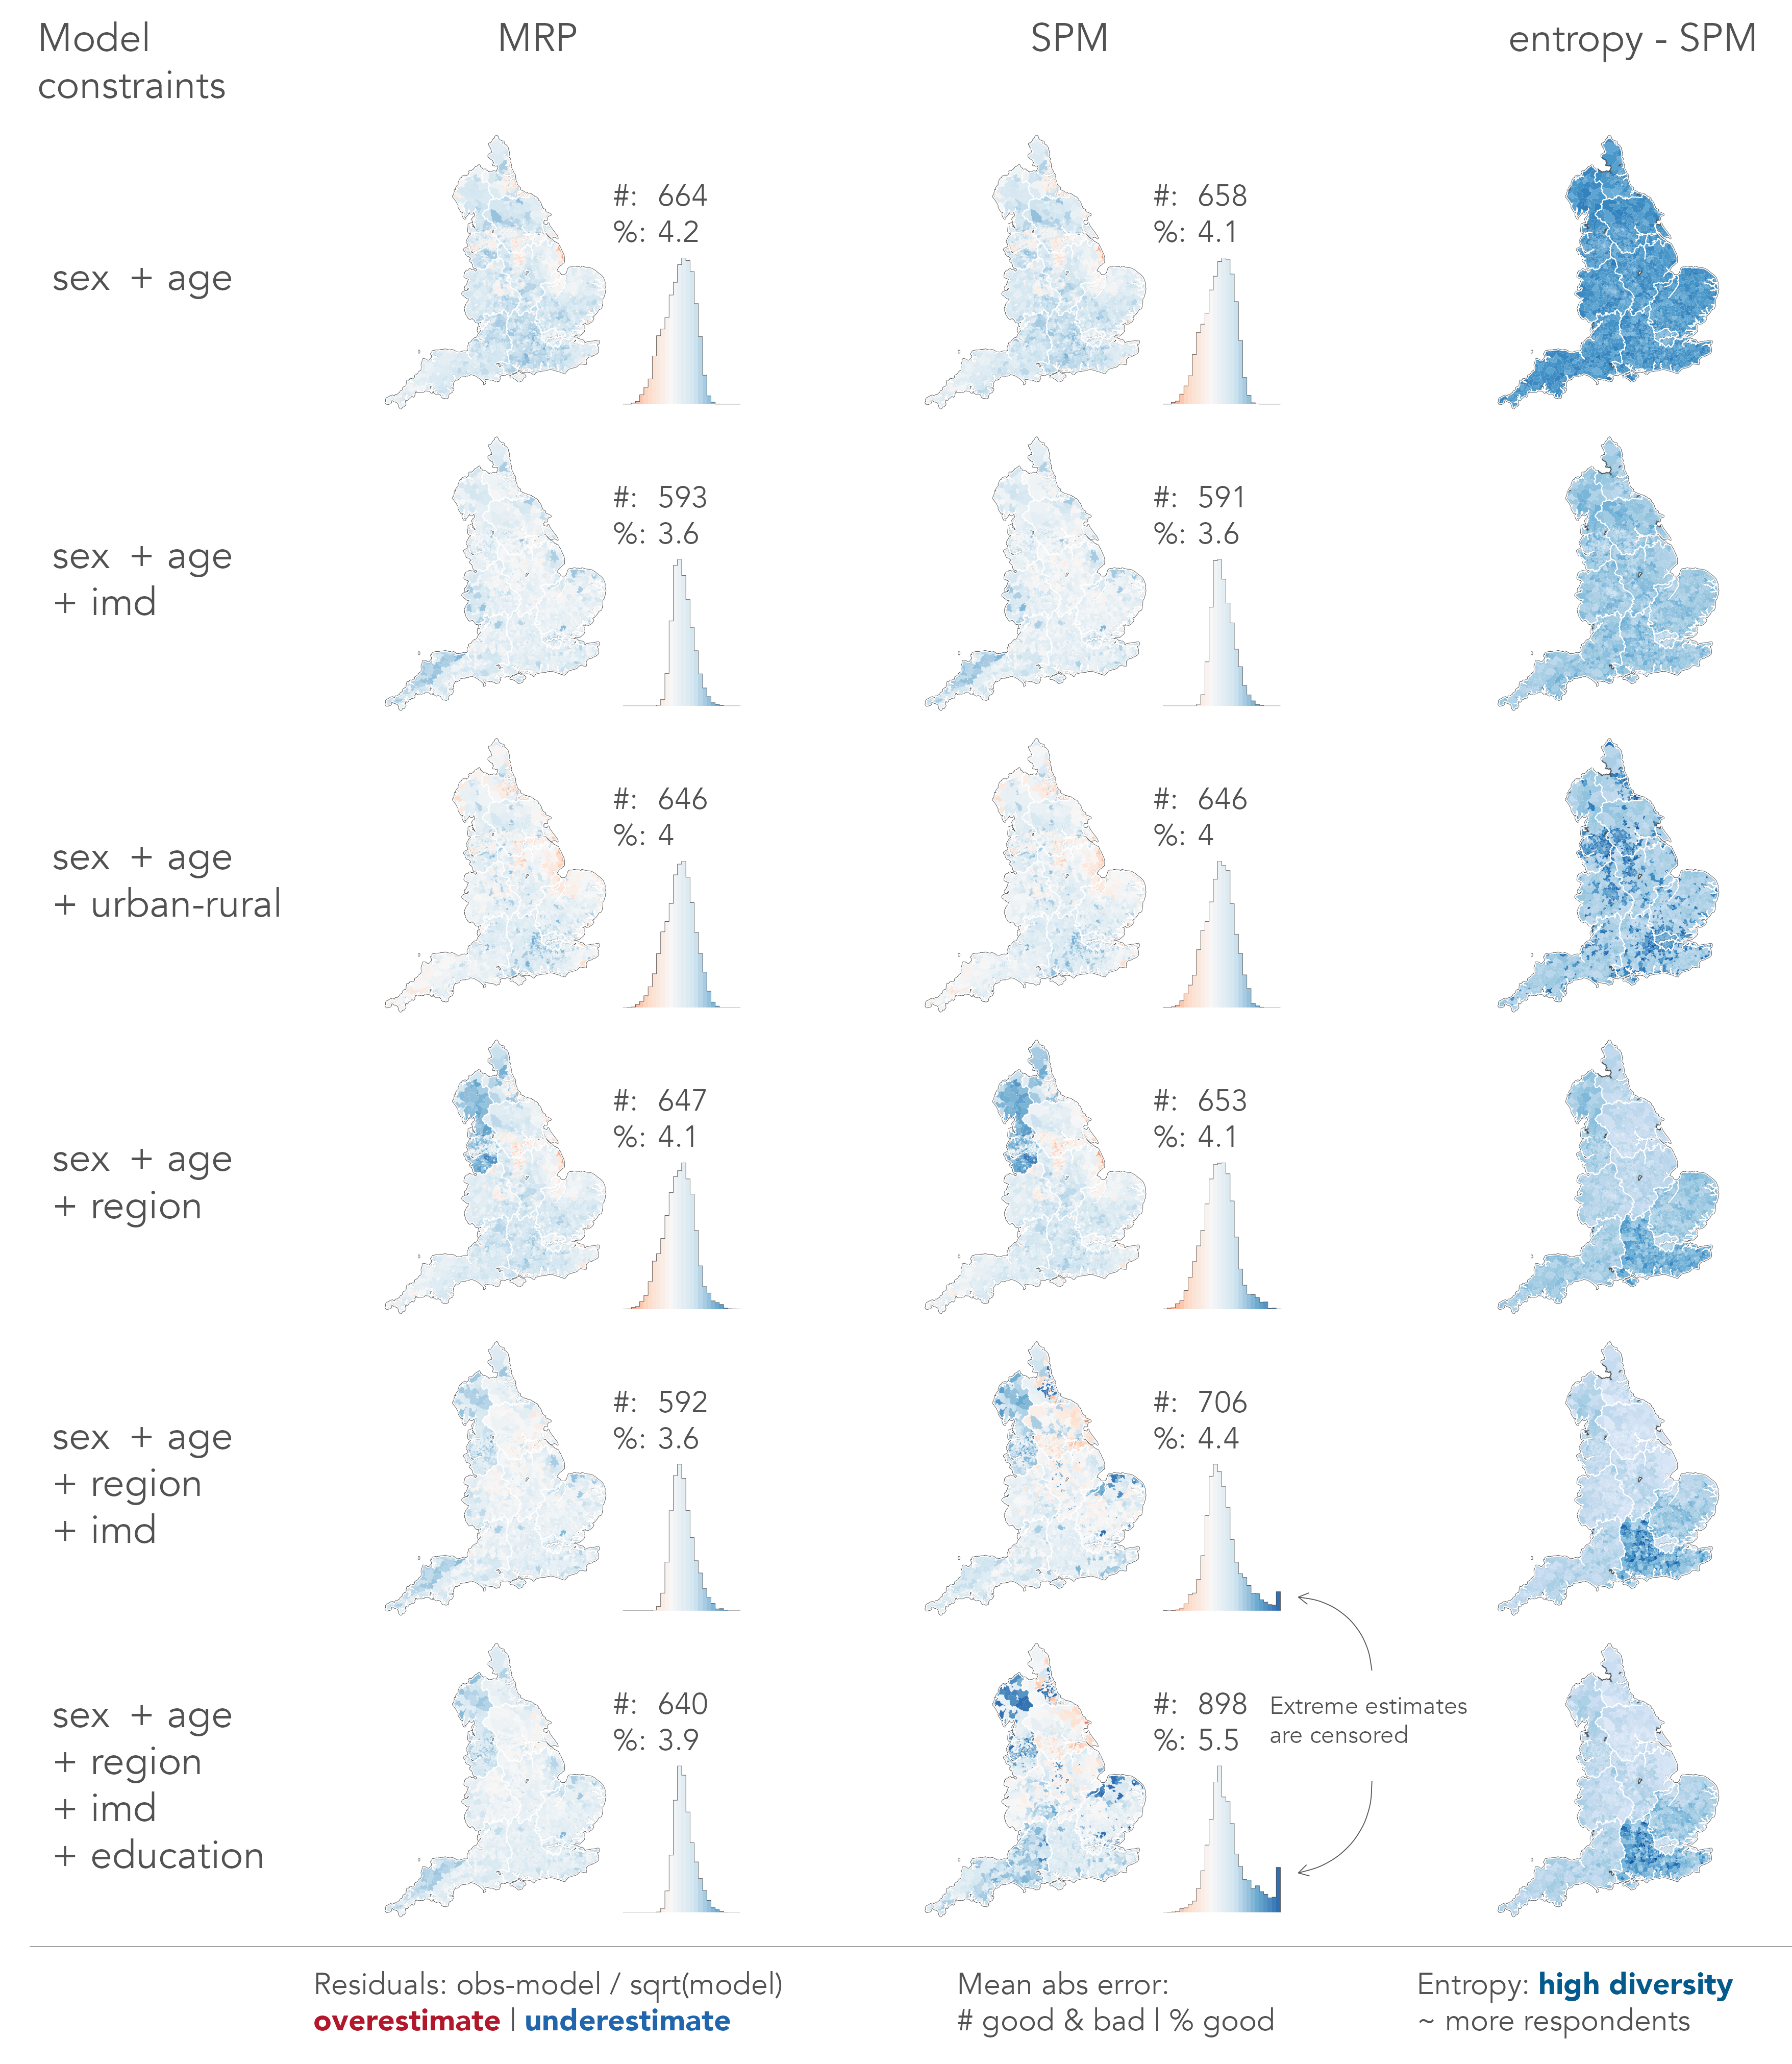
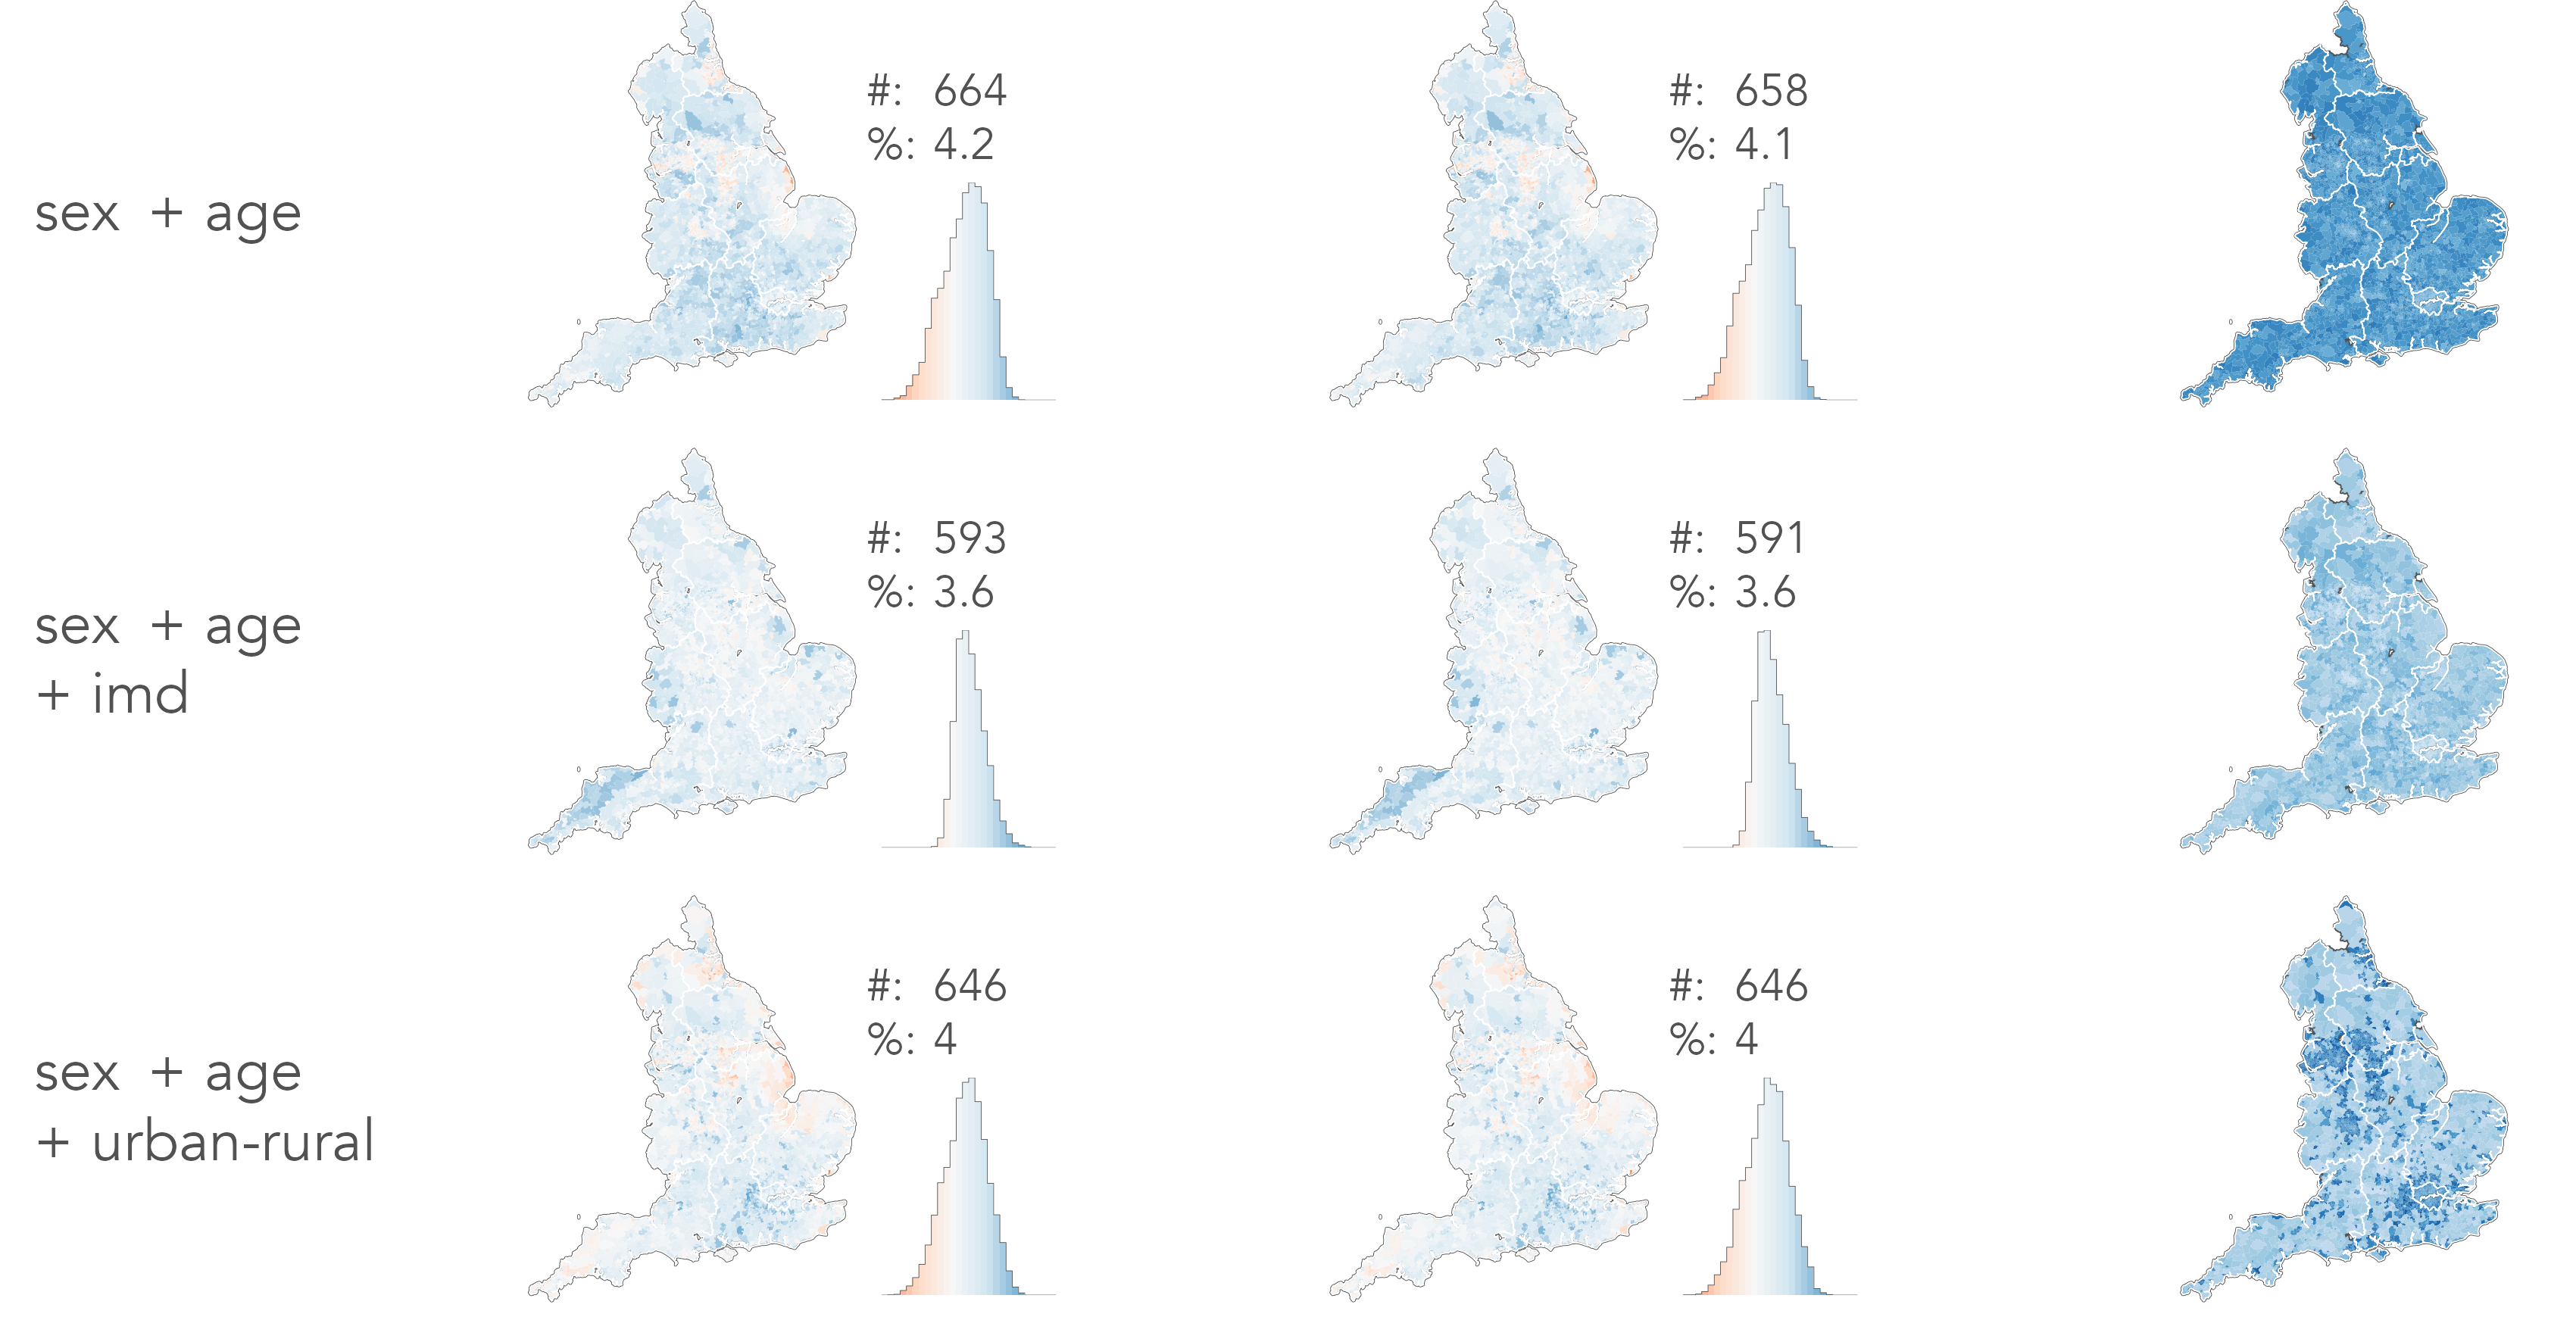
SPM designs
- Model 1
- {sex + age}
- Model 2
- {sex + age + imd}
- Model 3
- {sex + age + urban-rural}
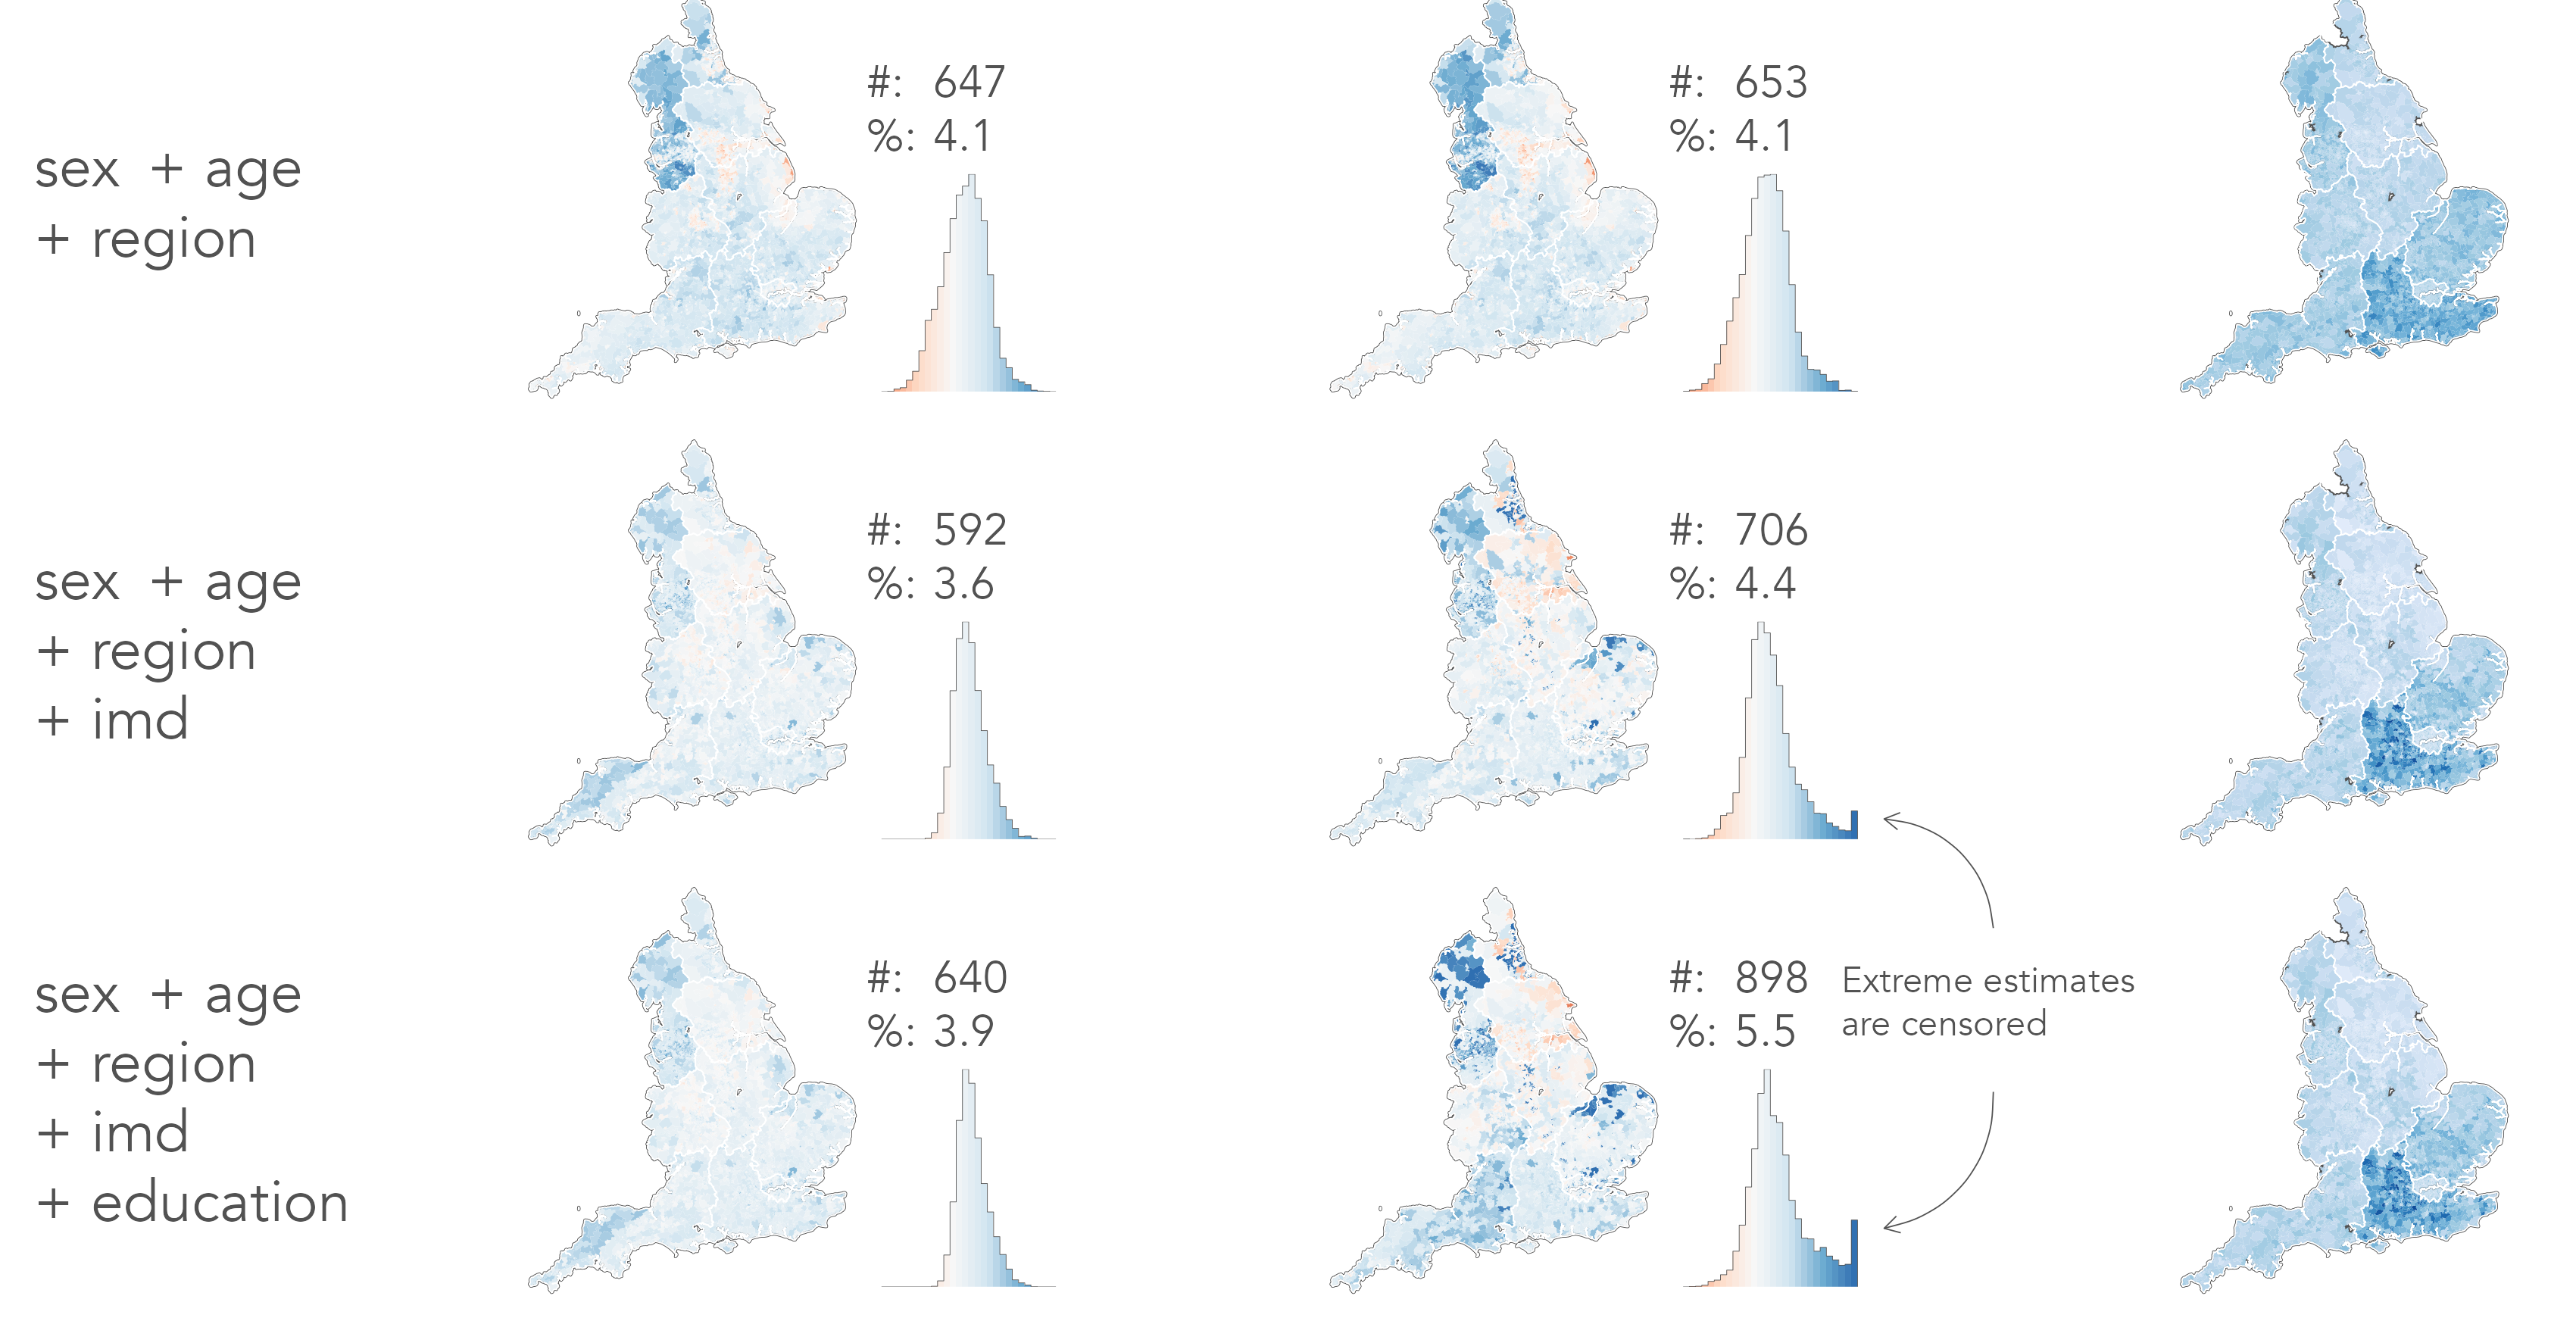
- Model 4
- {sex + age + region}
- Model 5
- {sex + age + region + imd}
- Model 6
- {sex + age + region + education}

MRP designs
- Model 1
- {sex + age}
- Model 2
- {sex + age + imd}
- Model 3
- {sex + age + urban-rural}
- Model 4
- {sex + age + region}
- Model 5
- {sex + age + region + imd}
- Model 6
- {sex + age + region + education}

Comparison metrics
- Mean Absolute Error
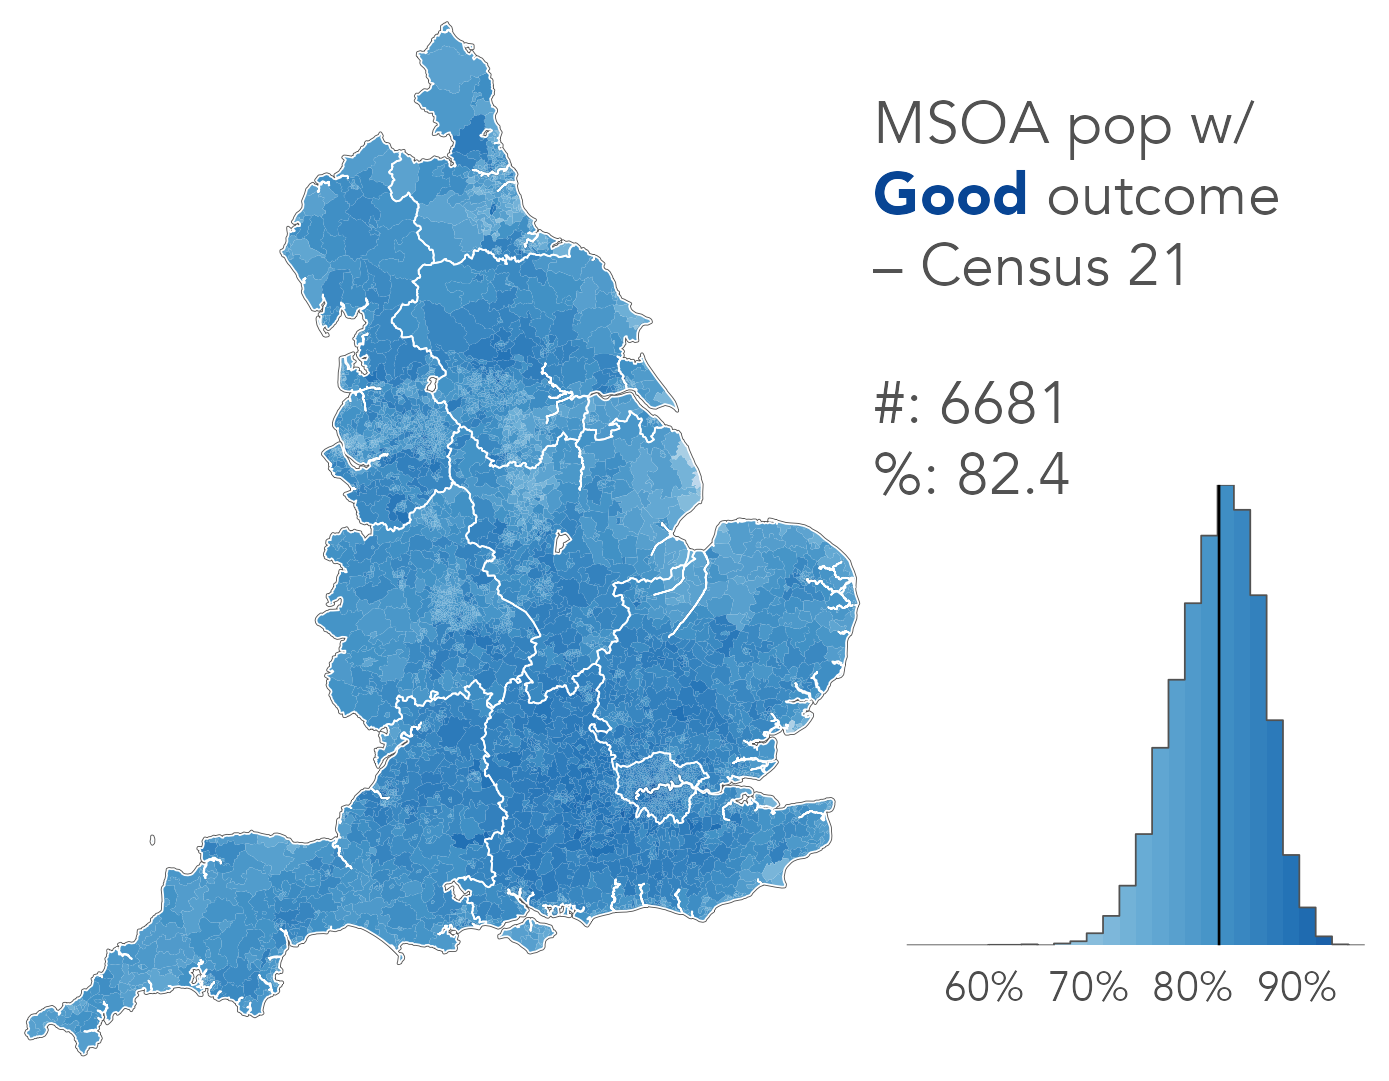
- # good | % good
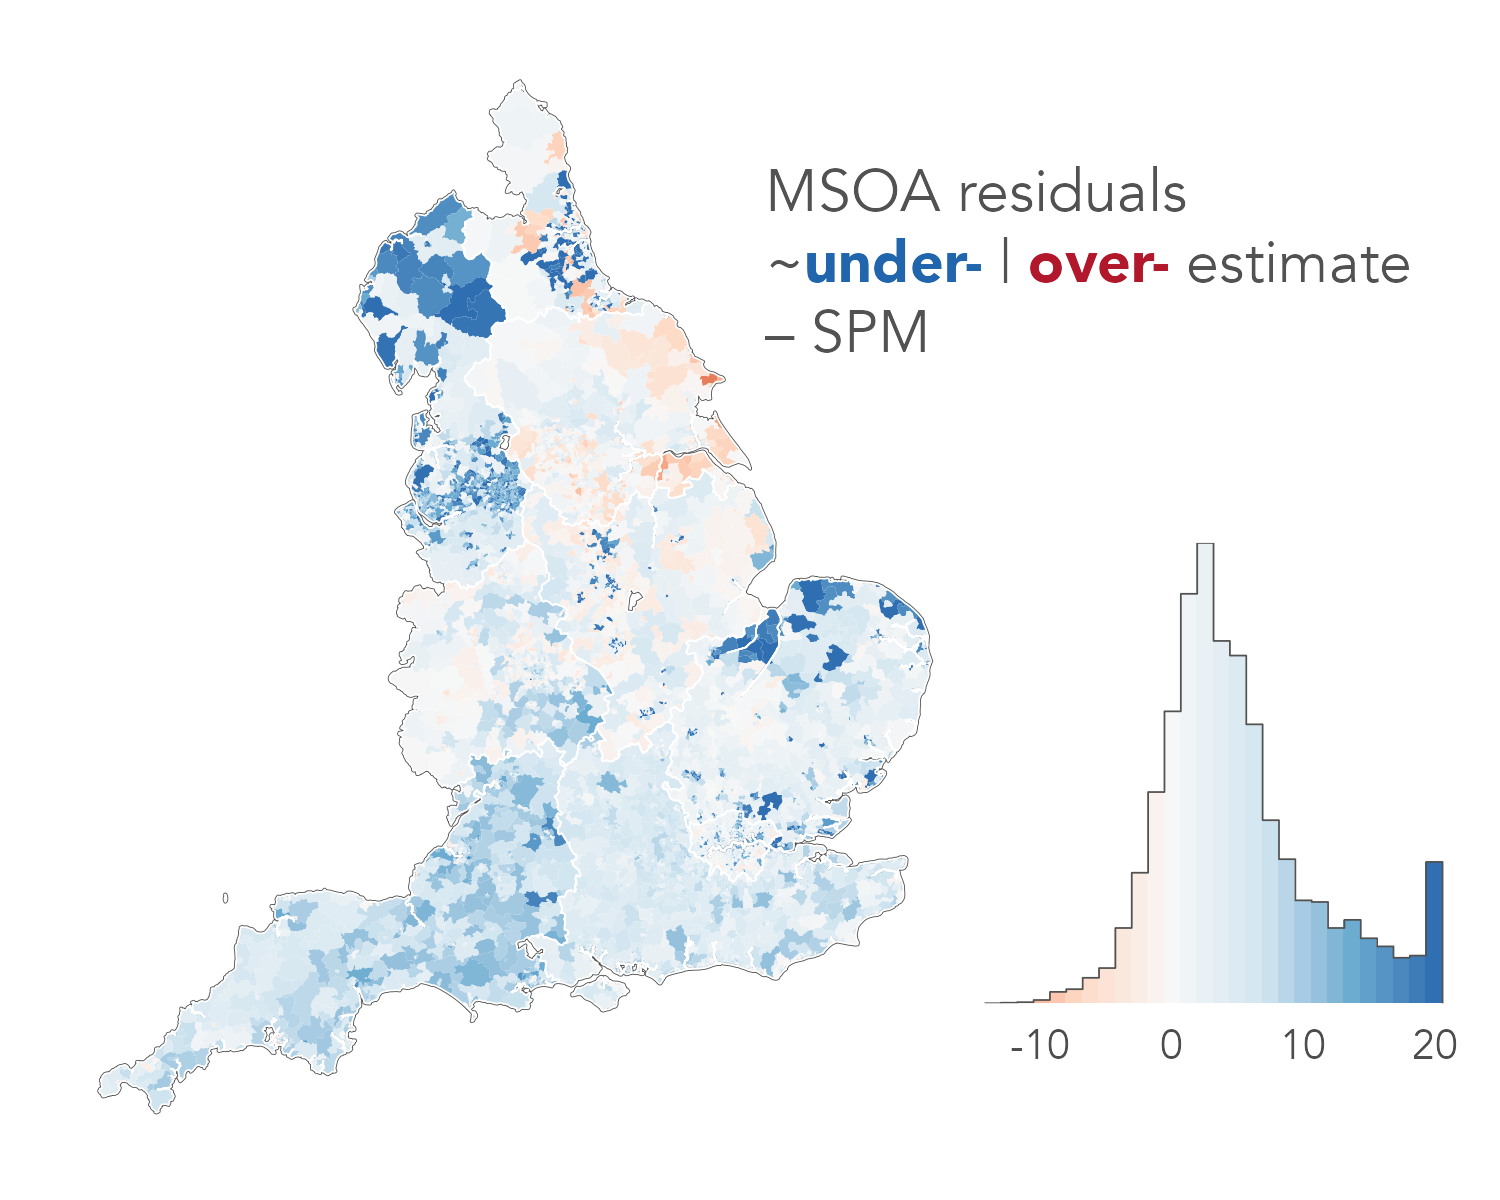
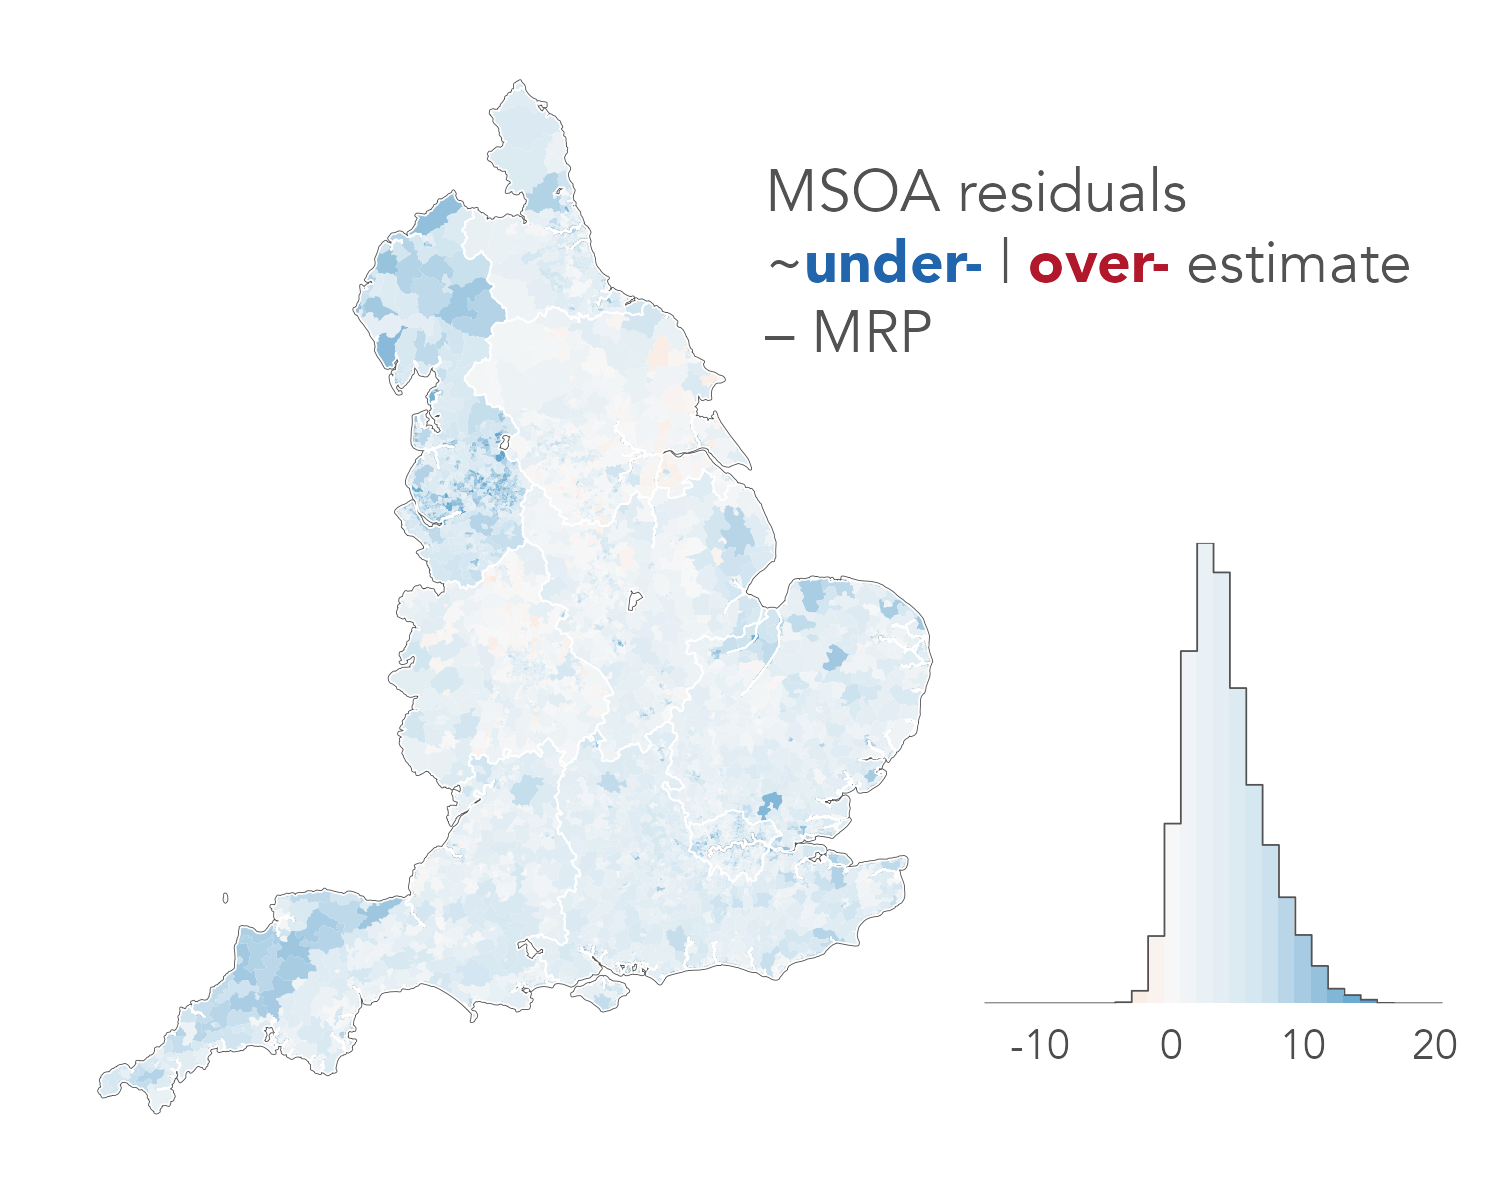
- Pearson Residuals
- obs-model / sqrt(model)
- Shannon Entropy
- SPM only
Comparison metrics
- Mean Absolute Error
- # good | % good
- Pearson Residuals
- obs-model / sqrt(model)
- Shannon Entropy
- SPM only
Comparison metrics
- Mean Absolute Error
- # good | % good
- Pearson Residuals
- obs-model / sqrt(model)
- Shannon Entropy
- SPM only
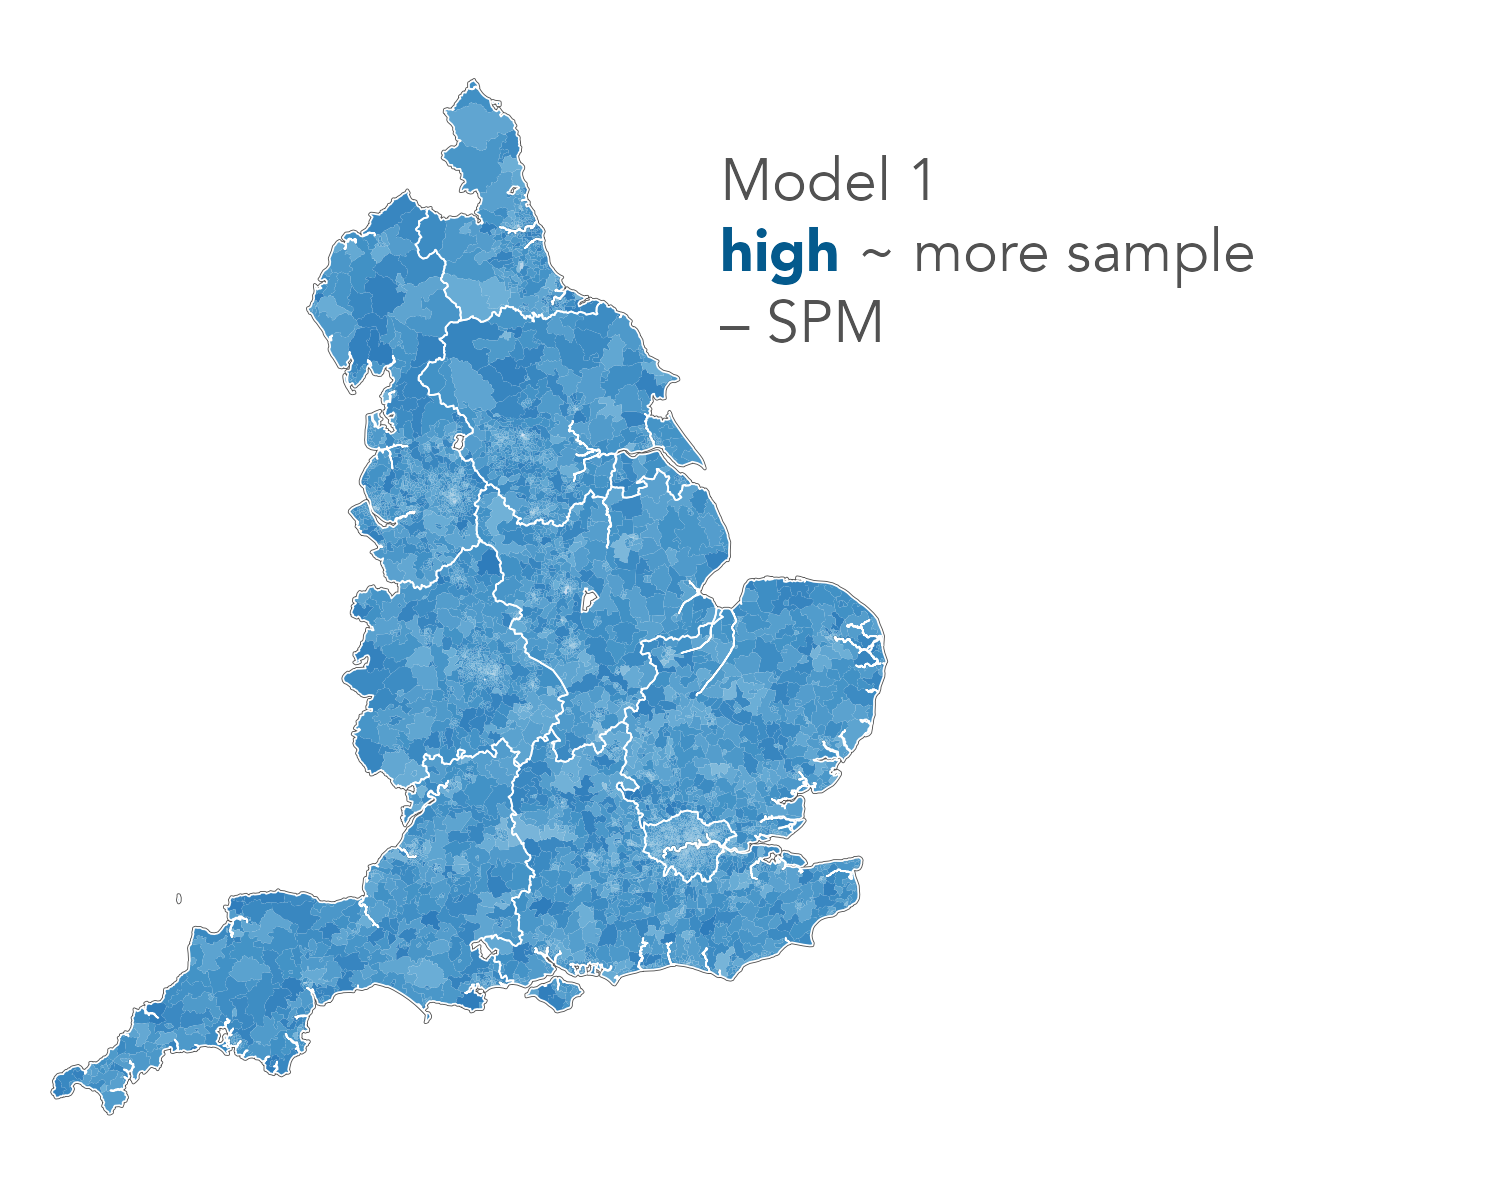
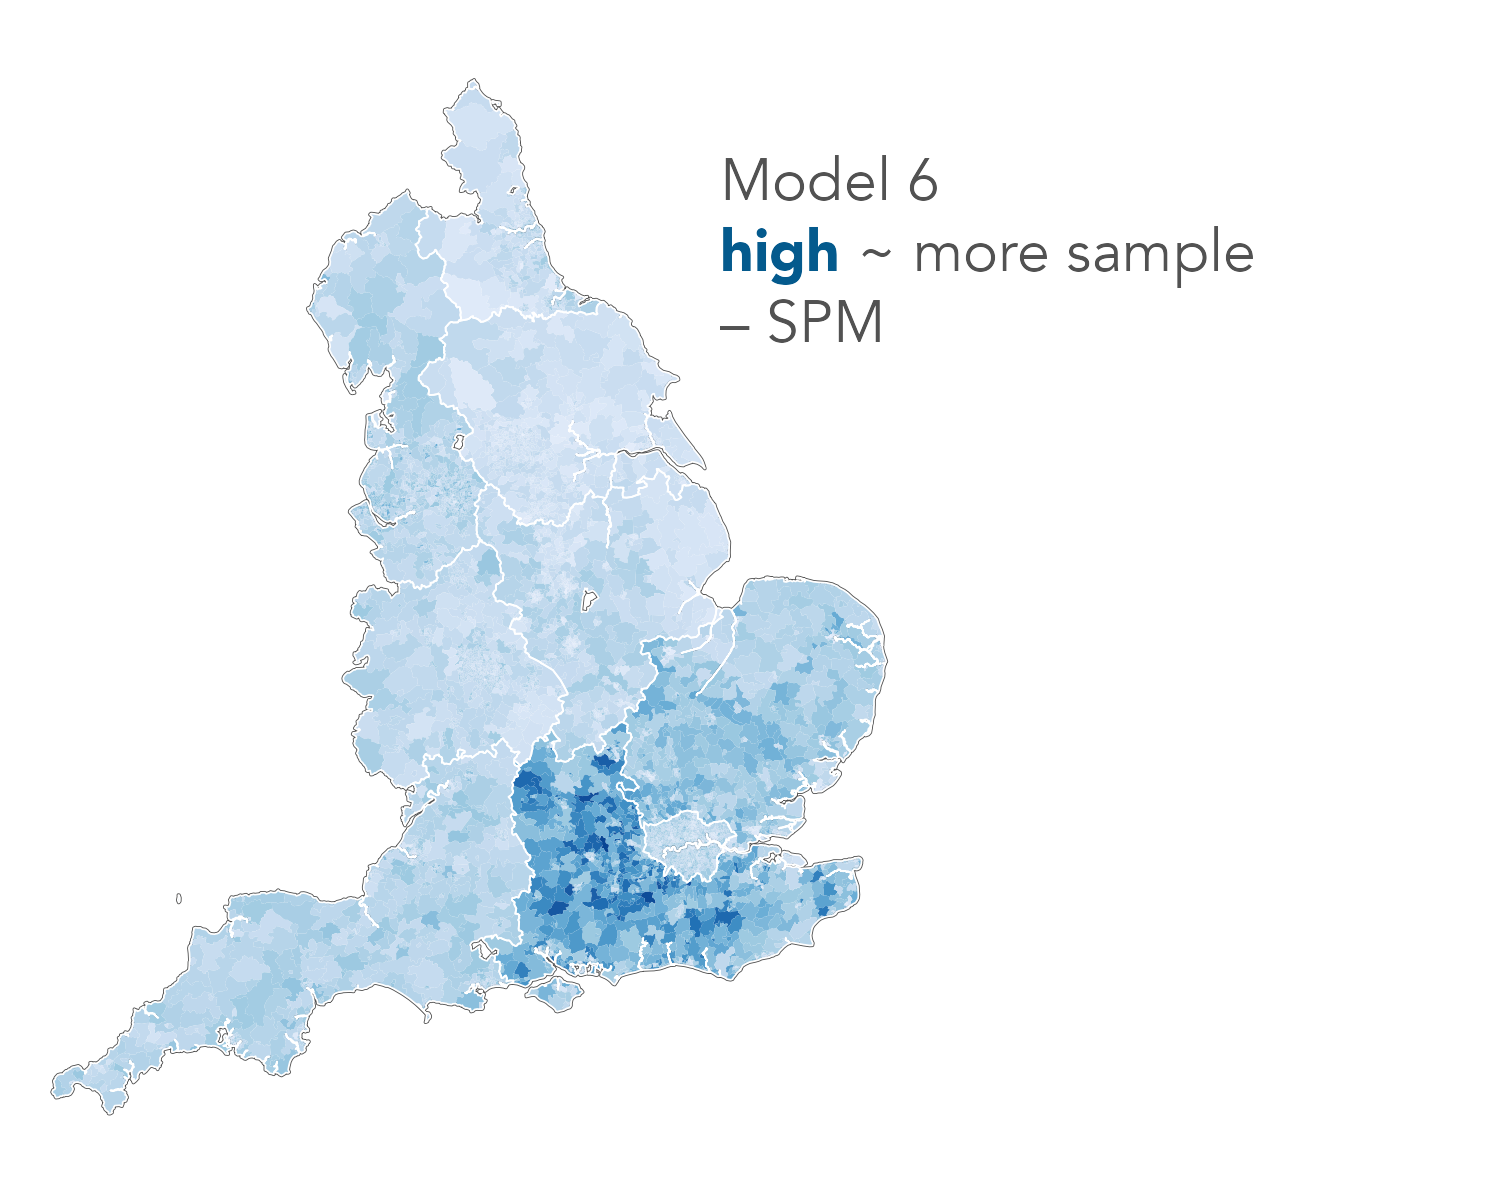
HSE underestimates
good outcome