
Important links
Abstract
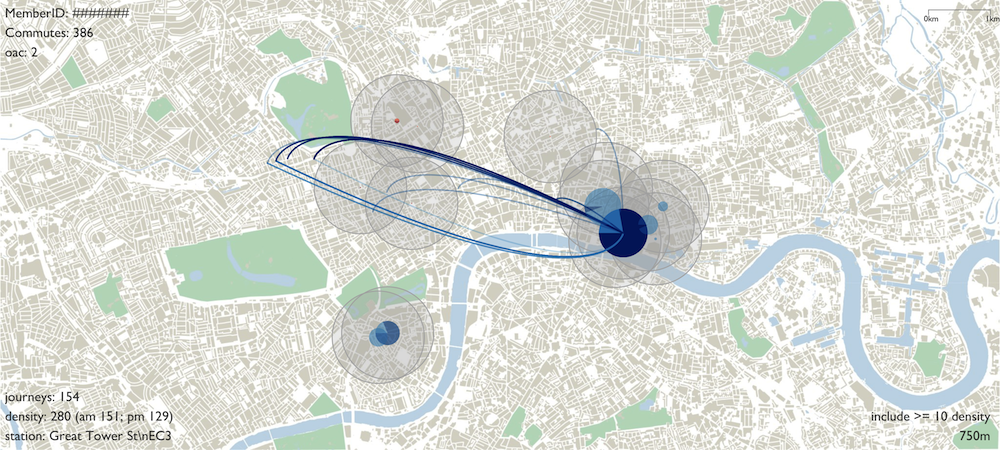
Mining a large origin–destination dataset of journeys made through London’s Cycle Hire Scheme (LCHS), we develop a technique for automatically classifying commuting behaviour that involves a spatial analysis of cyclists’ journeys. We identify a subset of potential commuting cyclists, and for each individual define a plausible geographic area representing their workplace. All peak-time journeys terminating within the vicinity of this derived workplace in the morning, and originating from this derived workplace in the evening, we label commutes. Three techniques for creating these workplace areas are compared using visual analytics: a weighted mean-centres calculation, spatial k-means clustering and a kernel density-estimation method. Evaluating these techniques at the individual cyclist level, we find that commuters’ peak-time journeys are more spatially diverse than might be expected, and that for a significant portion of commuters there appears to be more than one plausible spatial workplace area. Evaluating the three techniques visually, we select the density-estimation as our preferred method. Two distinct types of commuting activity are identified: those taken by LCHS customers living outside of London, who make highly regular commuting journeys at London’s major rail hubs; and more varied commuting behaviours by those living very close to a bike-share docking station. We find evidence of many interpeak journeys around London’s universities apparently being taken as part of cyclists’ working day. Imbalances in the number of morning commutes to, and evening commutes from, derived workplaces are also found, which might relate to local availability of bikes. Significant decisions around our workplace analysis, and particularly these broader insights into commuting behaviours, are discovered through exploring this analysis visually. The visual analysis approach described in the paper is effective in enabling a research team with varying levels of analysis experience to participate in this research. We suggest that such an approach is of relevance to many applied research contexts.
Important figure
BibTeX citation
@article{beecham_studying_2014,
    title={Studying commuting behaviours using collaborative visual analytics},
    author={Beecham, R. and Wood, J. and Bowerman, A.},
    journal={Computers, Environment and Urban Systems},
    year={2014},
    volume = {47},
    number={September},
    pages={5--15},
    publisher={Elsevier}
}