
Important links
Abstract
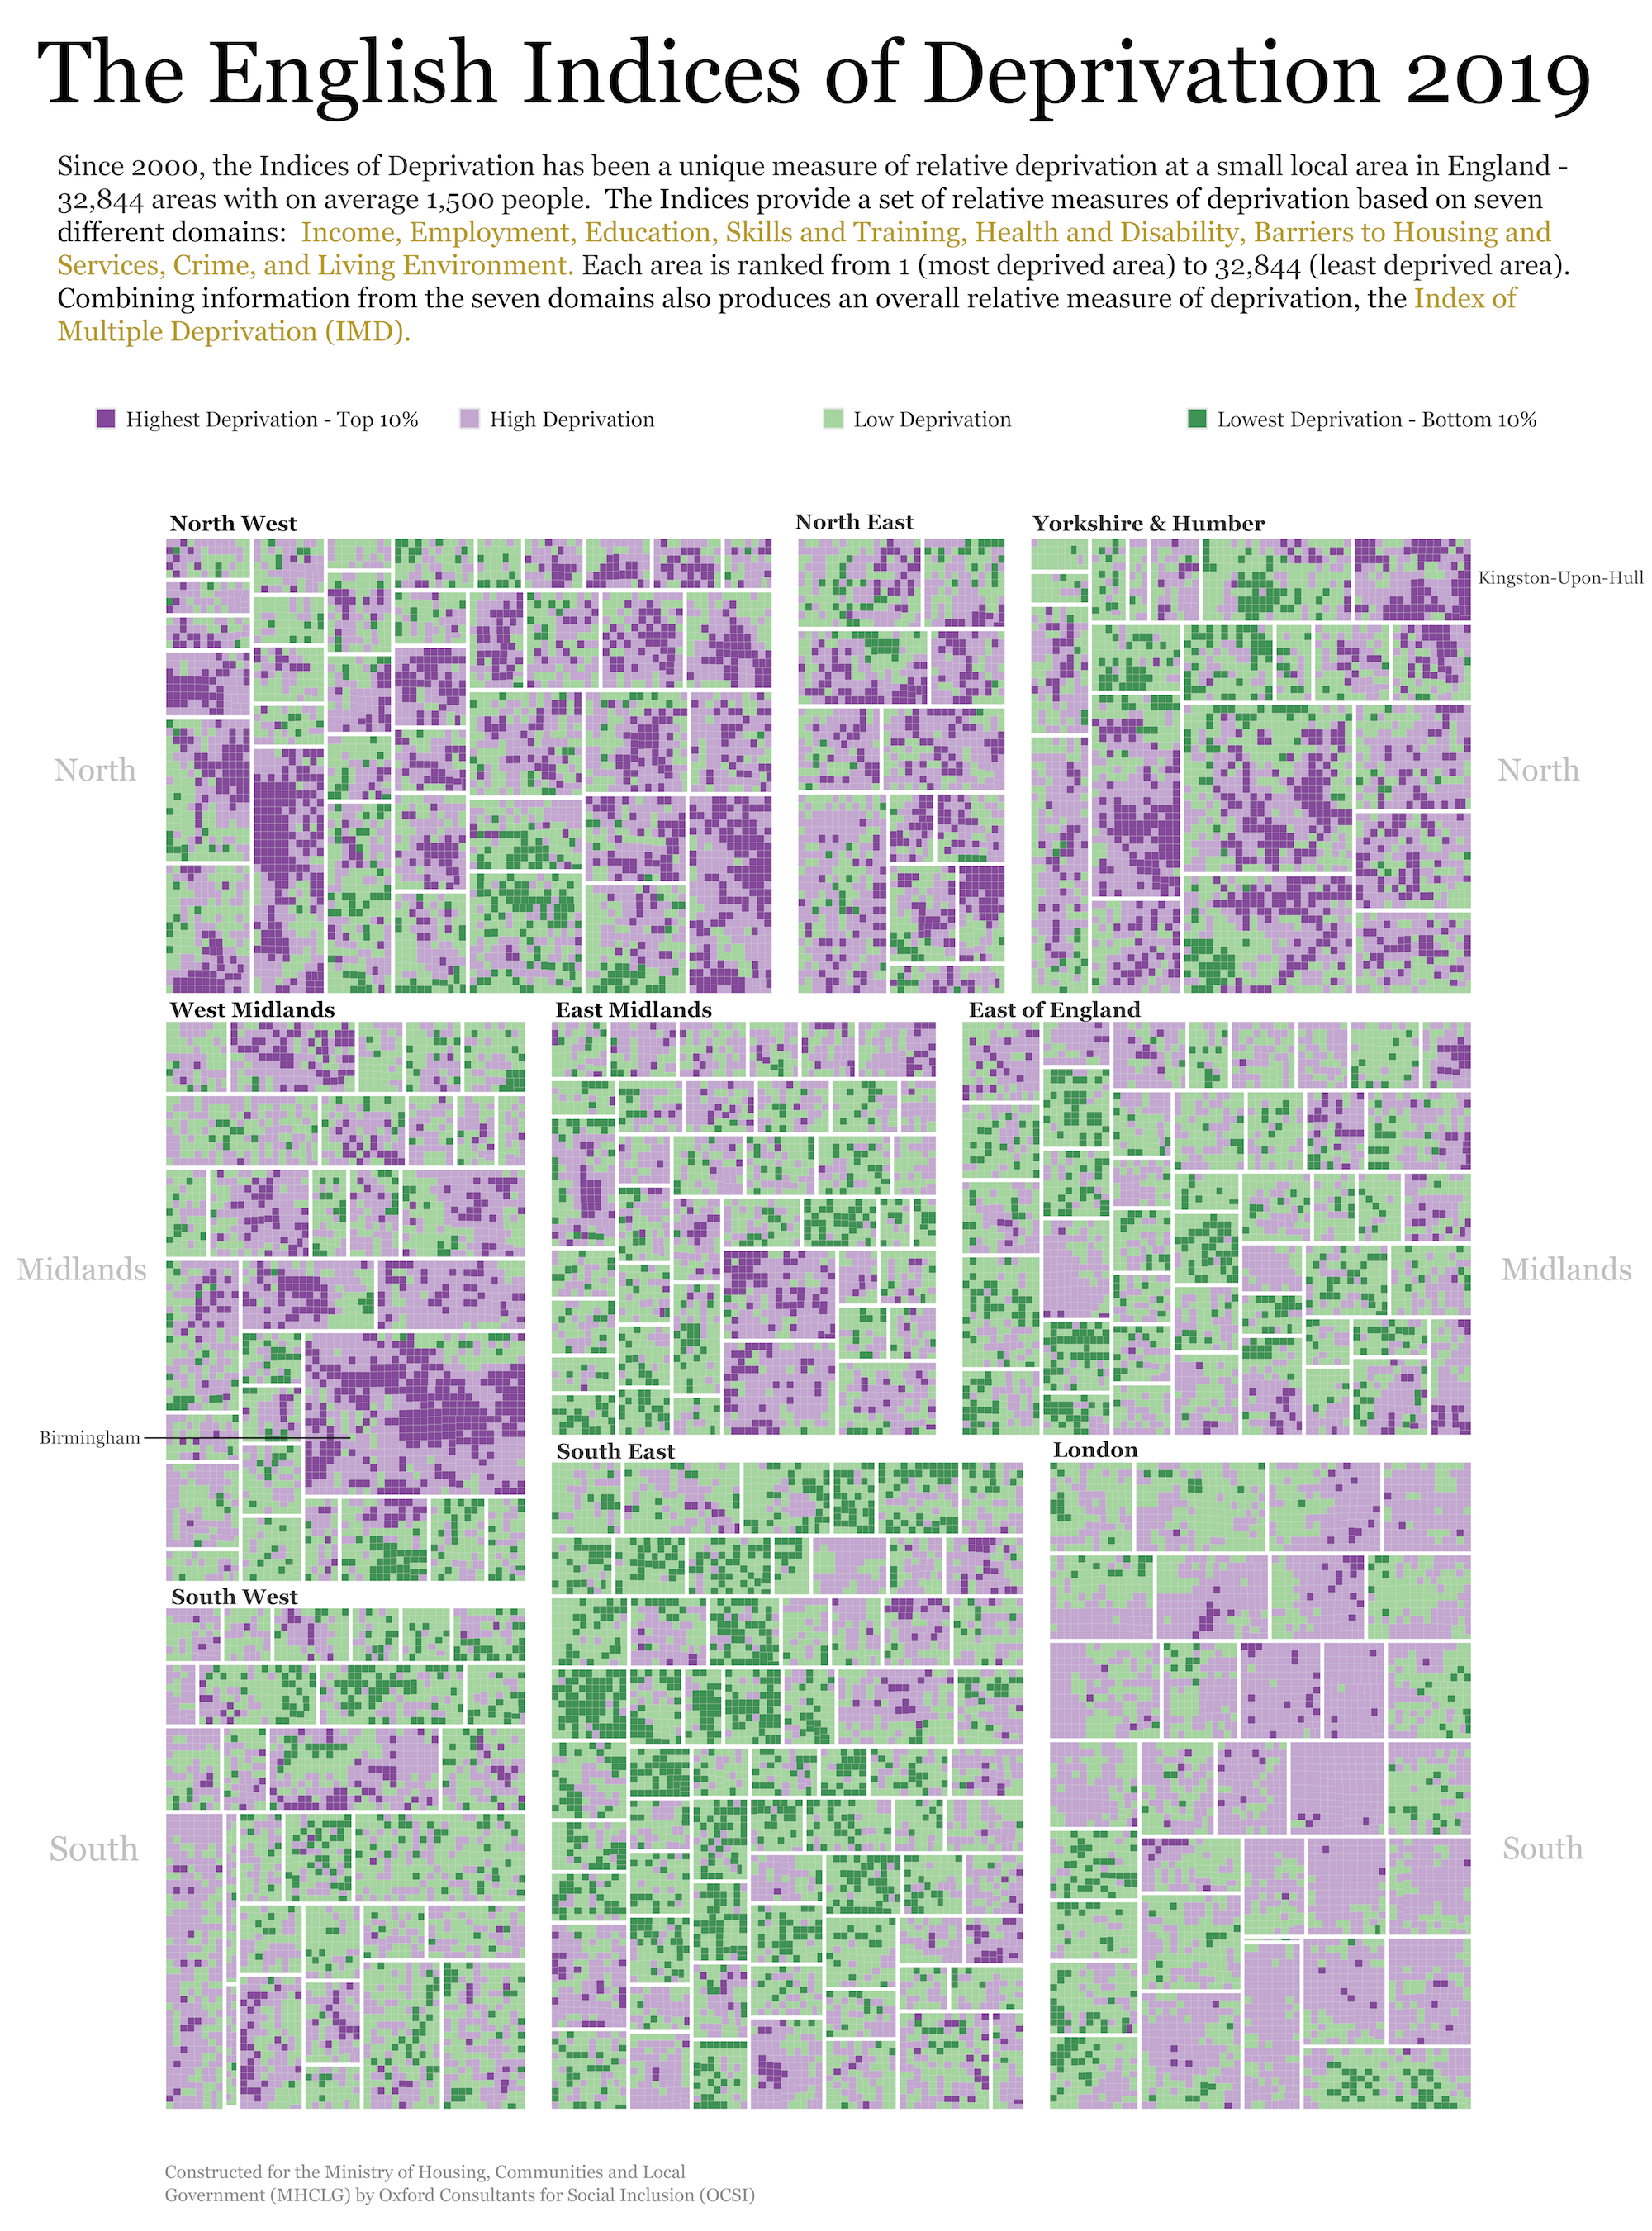
Our regional graphic maps deprivation for small neighbourhoods in England in a way that enables the extent, distribution and spatial structure of deprivation to be perceived at multiple levels of geography. All 32,844 neighbourhoods are depicted using rectangles of constant size and with an approximate geographical arrangement. This approach overcomes familiar cartographic challenges when representing demographic data, exposing local pockets of deprivation that would otherwise be obscured in a conventional map. Neighbourhoods are nested hierarchically, and this hierarchy is emphasized in our design, allowing analysis within and between regions. The graphic reveals important spatial processes – rich patterns of continuity and discontinuity at multiple spatial scales – that may not be as effectively represented using non-visual means.
Important figure
BibTeX citation
@article{radburn_mapping_2021,
    author = {Robert Radburn and Roger Beecham},
    doi = {10.1080/21681376.2021.1934528},
    journal = {Regional Studies, Regional Science},
    number = {1},
    pages = {269-272},
    title = {Mapping deprivation for each and every small area in England},
    volume = {8},
    year = {2021}