
Important links
Abstract
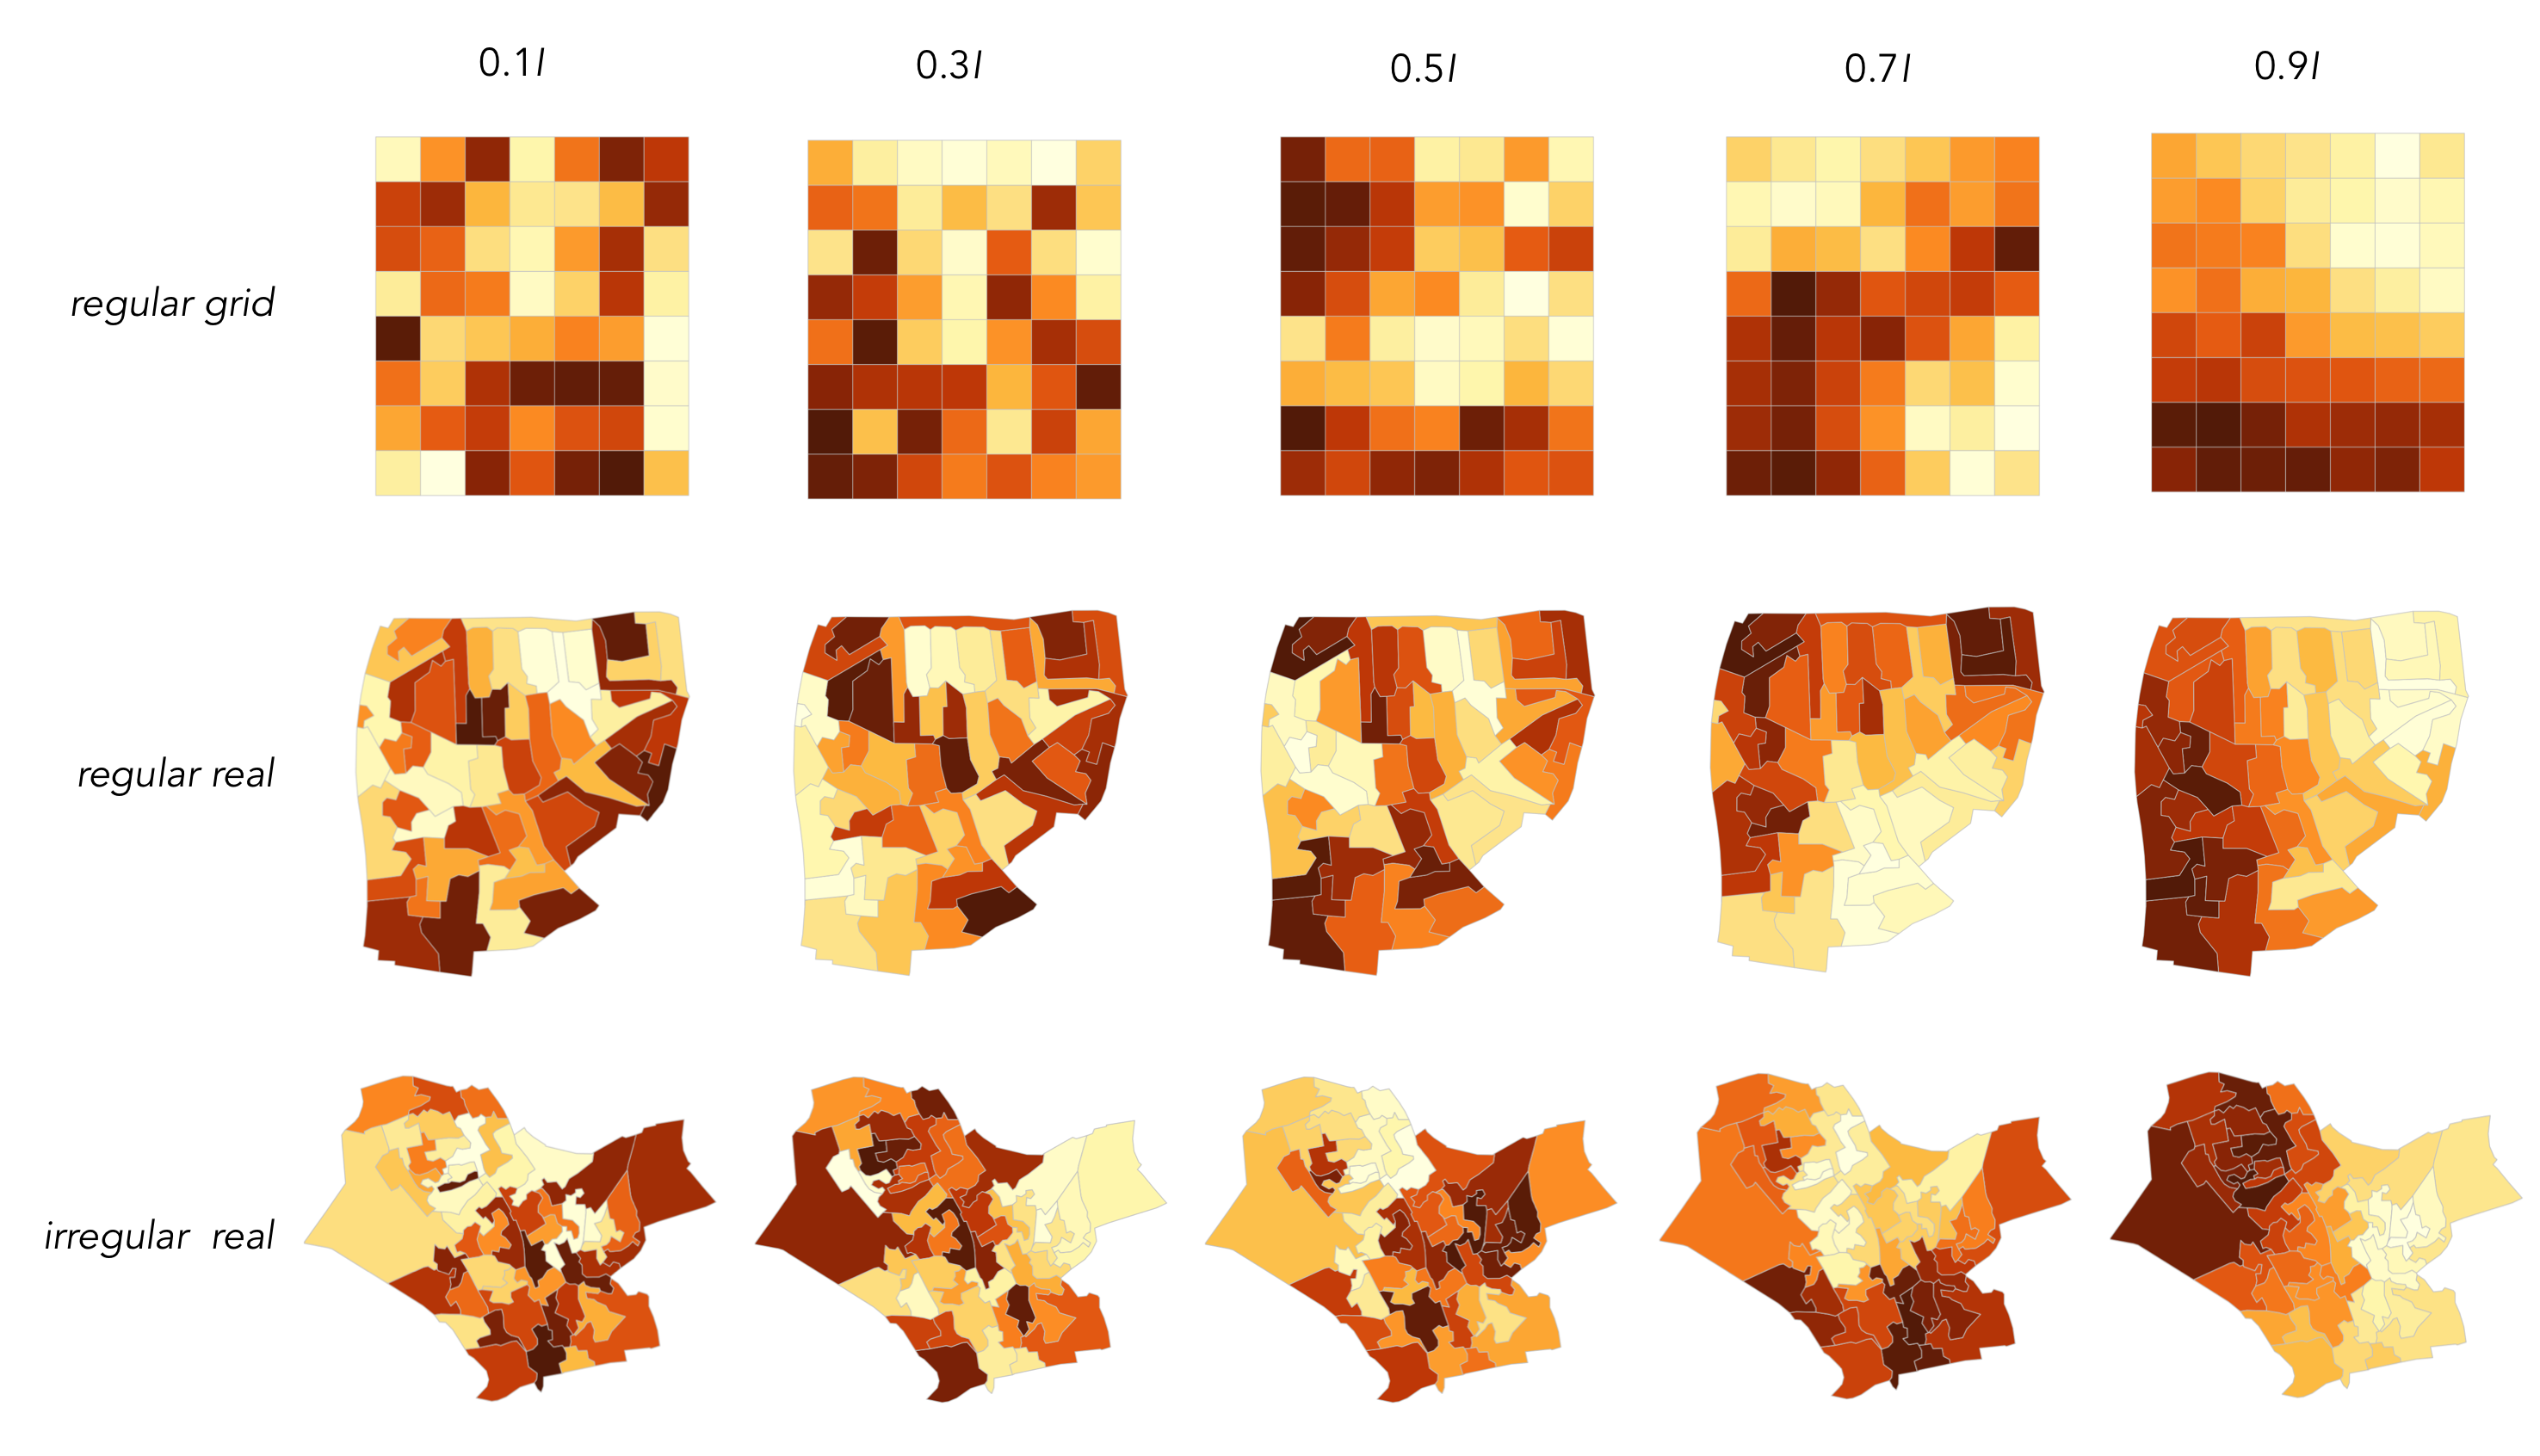
Fundamental to the effective use of visualization as an analytic and descriptive tool is the assurance that presenting data visually provides the capability of making inferences from what we see. This paper explores two related approaches to quantifying the confidence we may have in making visual inferences from mapped geospatial data. We adapt Wickham et al.’s `Visual Line-up’ method as a direct analogy with Null Hypothesis Significance Testing (NHST) and propose a new approach for generating more credible spatial null hypotheses. Rather than using as a spatial null hypothesis the unrealistic assumption of complete spatial randomness, we propose spatially autocorrelated simulations as alternative nulls. We conduct a set of crowdsourced experiments (n = 361) to determine the just noticeable difference (JND) between pairs of choropleth maps of geographic units controlling for spatial autocorrelation (Moran’s I statistic) and geometric configuration (variance in spatial unit area). Results indicate that people’s abilities to perceive differences in spatial autocorrelation vary with baseline autocorrelation structure and the geometric configuration of geographic units. These results allow us, for the first time, to construct a visual equivalent of statistical power for geospatial data. Our JND results add to those provided in recent years by Klippel et al. (2011), Harrison et al. (2014) and Kay & Heer (2015) for correlation visualization. Importantly, they provide an empirical basis for an improved construction of visual line-ups for maps and the development of theory to inform geospatial tests of graphical inference.
Important figure
BibTeX citation
@article{beecham_map_2017,
    title = {Map line-ups: effects of spatial structure on graphical inference},
          journal = {{IEEE} Transactions on Visualization and Computer Graphics},
    author = {Beecham, R. and Dykes, J. and Meulemans, W. and Slingsby, A. and Turkay, C. and Wood, J.},
    volume =  {23},
    number = {1},
    pages = {391--400},
    year = {2017}
}