
Important links
Abstract
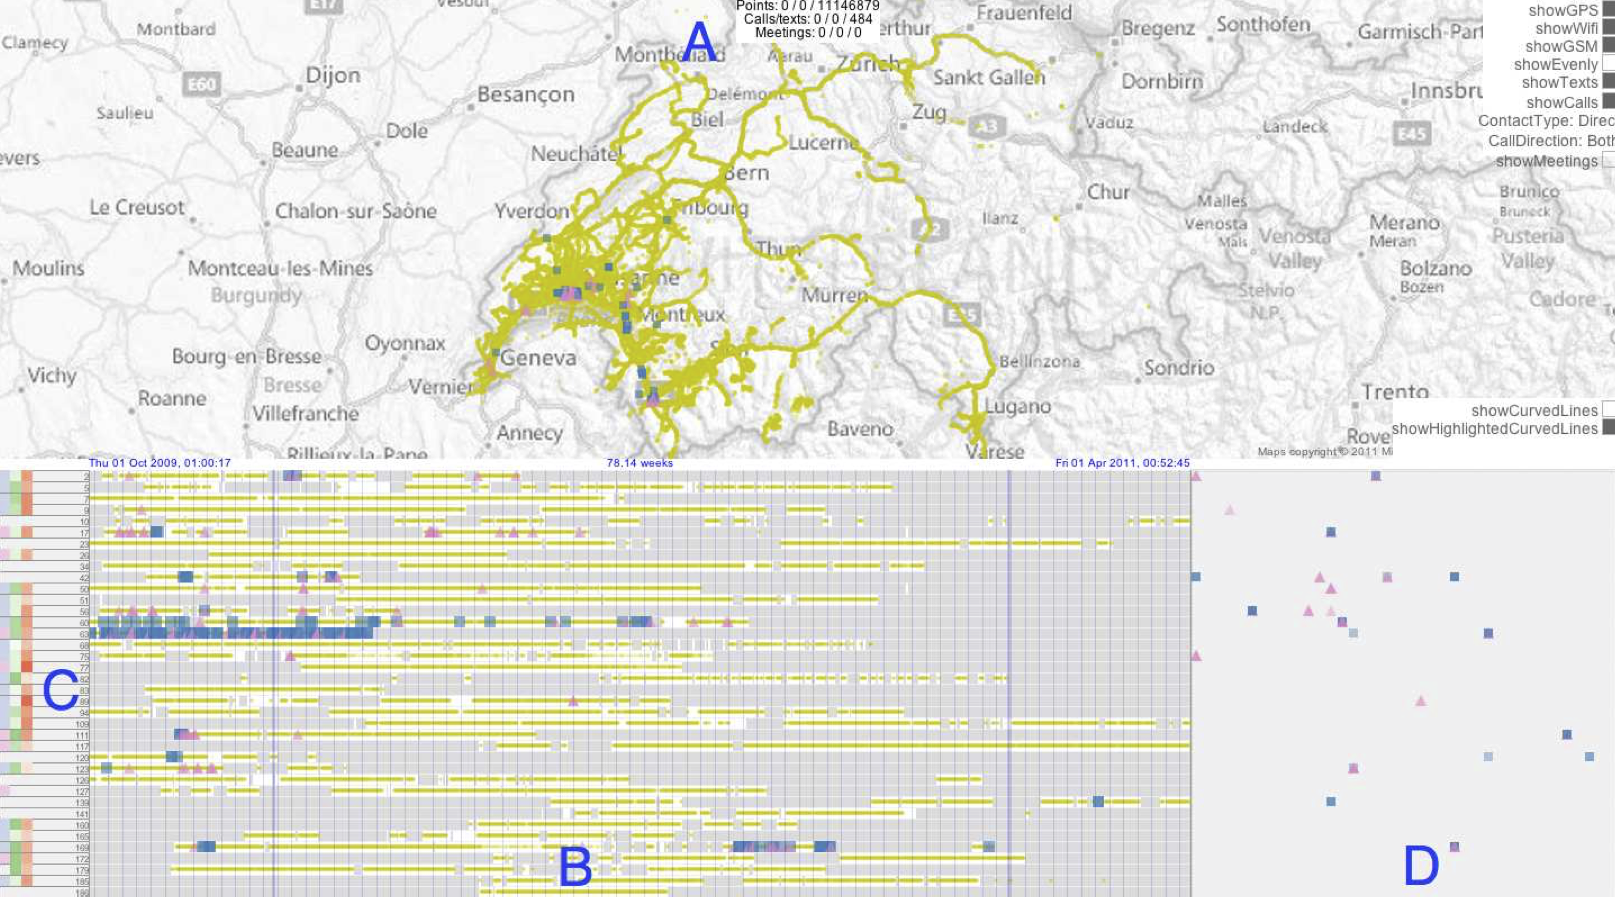
We designed and applied interactive visualisation techniques for investigating how social networks are embedded in time and space, using data collected from smartphone logs. Our interest in spatial aspects of social networks is that they may reveal associations between participants missed by simply making contact through smartphone devices. Four linked and co-ordinated views of spatial, temporal, individual and social network aspects of the data, along with demographic and attitudinal variables, helped add context to the behaviours we observed. Using these techniques, we were able to characterise spatial and temporal aspects of participants’ social networks and suggest explanations for some of them. This provides some validation of our techniques.
Unexpected deficiencies in the data that became apparent prompted us to evaluate the dataset in more detail. Contrary to what we expected, we found significant gaps in participant records, particularly in terms of location, a poorly connected sample of participants and asymmetries in reciprocal call logs. Although the data captured are of high quality, deficiencies such as these remain and are likely to have a significant impact on interpretations relating to spatial aspects of the social network. We argue that appropriately-designed interactive visualisation techniques–afforded by our flexible prototyping approach–are effective in identifying and characterising data inconsistencies. Such deficiencies are likely to exist in other similar datasets, and although the visual approaches we discuss for identifying data problems may not be scalable, the categories of problems we identify may be used to inform attempts to systematically account for errors in larger smartphone datasets.
Important figure
BibTeX citation
@article{slingsby_visual_2013,
    title = {Visual analysis of social networks in space and time using smartphone logs},
    volume = {9},
    number = {6},
    journal = {Pervasive and Mobile Computing},
    author = {Slingsby, A. and Beecham, R. and Wood, J.},
    year = {2013},
    pages = {848--864}
}