
Introduction
Through Infuze we will build models that simulate individuals’ everyday travel activities and evaluate how well – quickly, comfortably, affordably – existing and newly proposed transport options support those activities. Attending to everyday journeys is undoubtly necessary. But people are not empty economic units. It would be wrong to assume that individuals’ transport behaviours can be reduced simply to efficiency in meeting, or ‘utility maximising’, their travel routines.
In this short blog post, I take a look at data from the Census, the Department for Transport’s Journey Time Statistics and National Travel Attitudes Survey, and produce some graphics that profile how neighbourhoods in Leeds are already supported by transport alternatives to the car. In each I consider how transport provision maps to levels of car ownership. The point of this being that, if shifting behaviour away from cars was only about provisioning car alternatives, then neighbourhoods with the most viable alternatives might be those the with the lowest levels of existing car ownership.
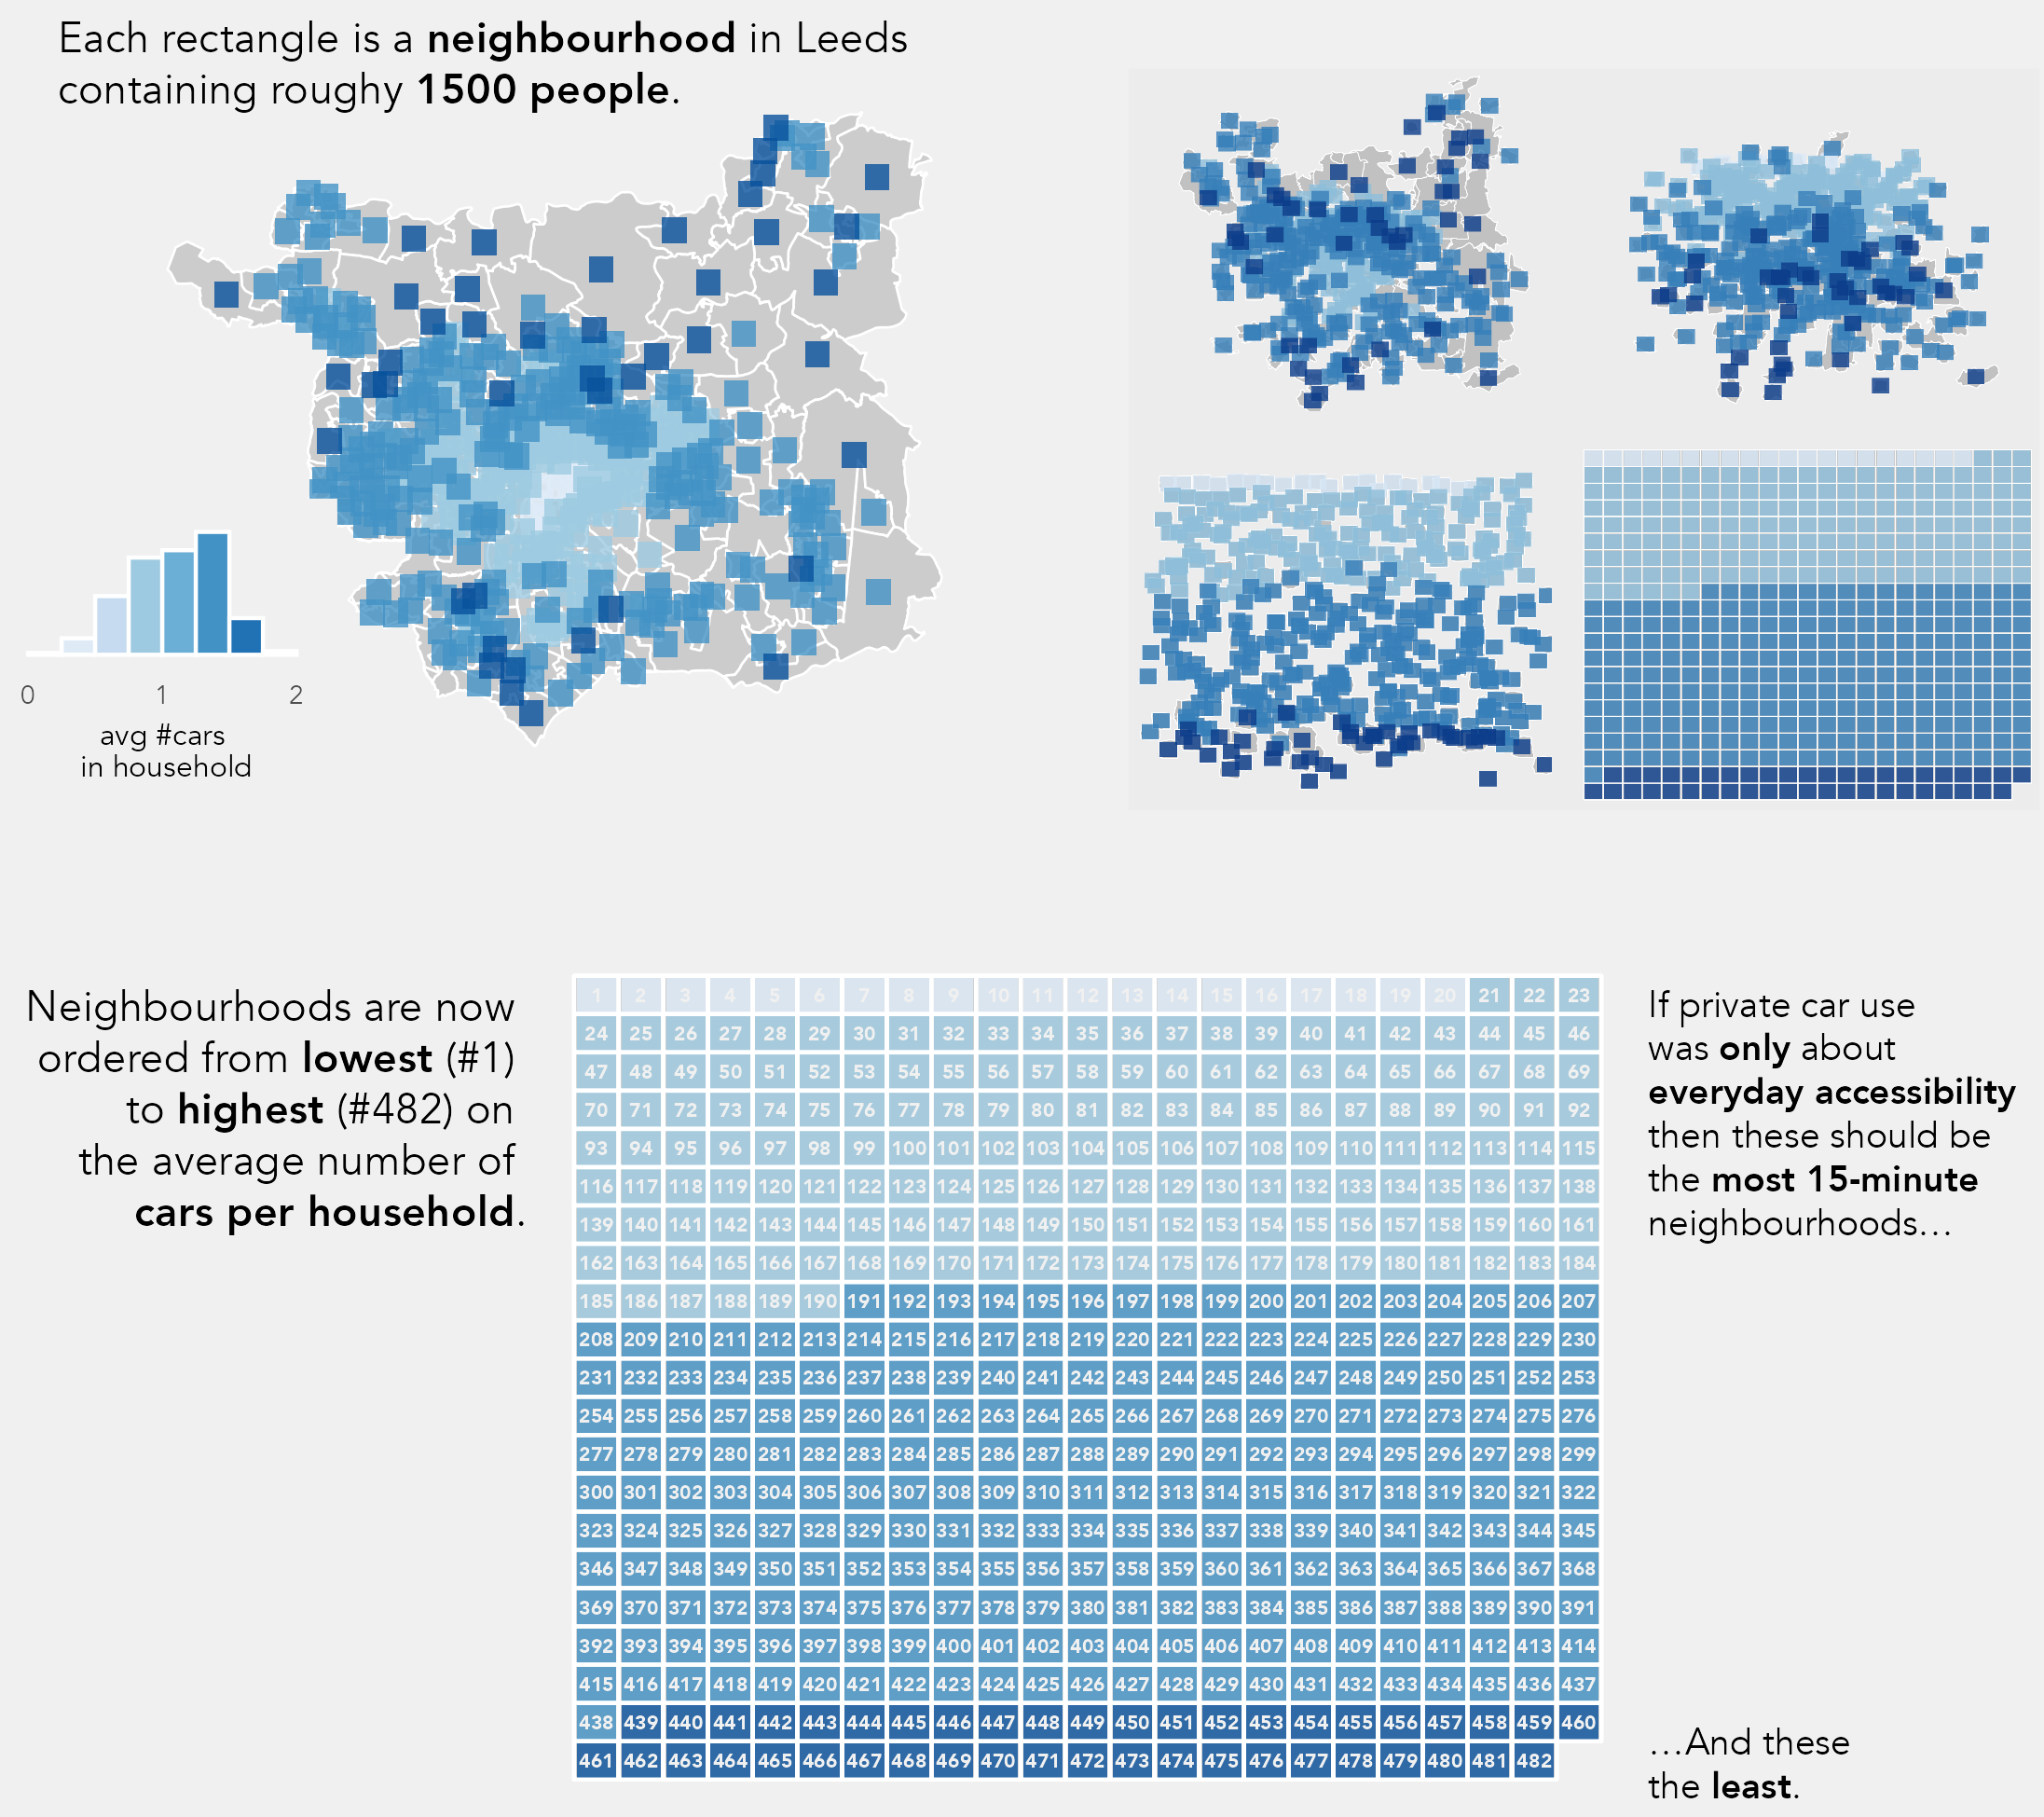
Car ownership in small area neighbourhoods of Leeds
First, let’s introduce our units of analysis: Lower Super Output Areas. These are small area neighbourhoods containing roughly 1500 people. There are 482 LSOAs in Leeds.
In the map below I encode each as a square and colour the squares according to the average number of cars owned per household. I then reorder the neighbourhood squares highest to lowest on levels of car ownership. Despite the unfortunate (and silly) political loading, I’ll then use the idea of the 15-minute city to evaluate neighbourhood-level transport provision.
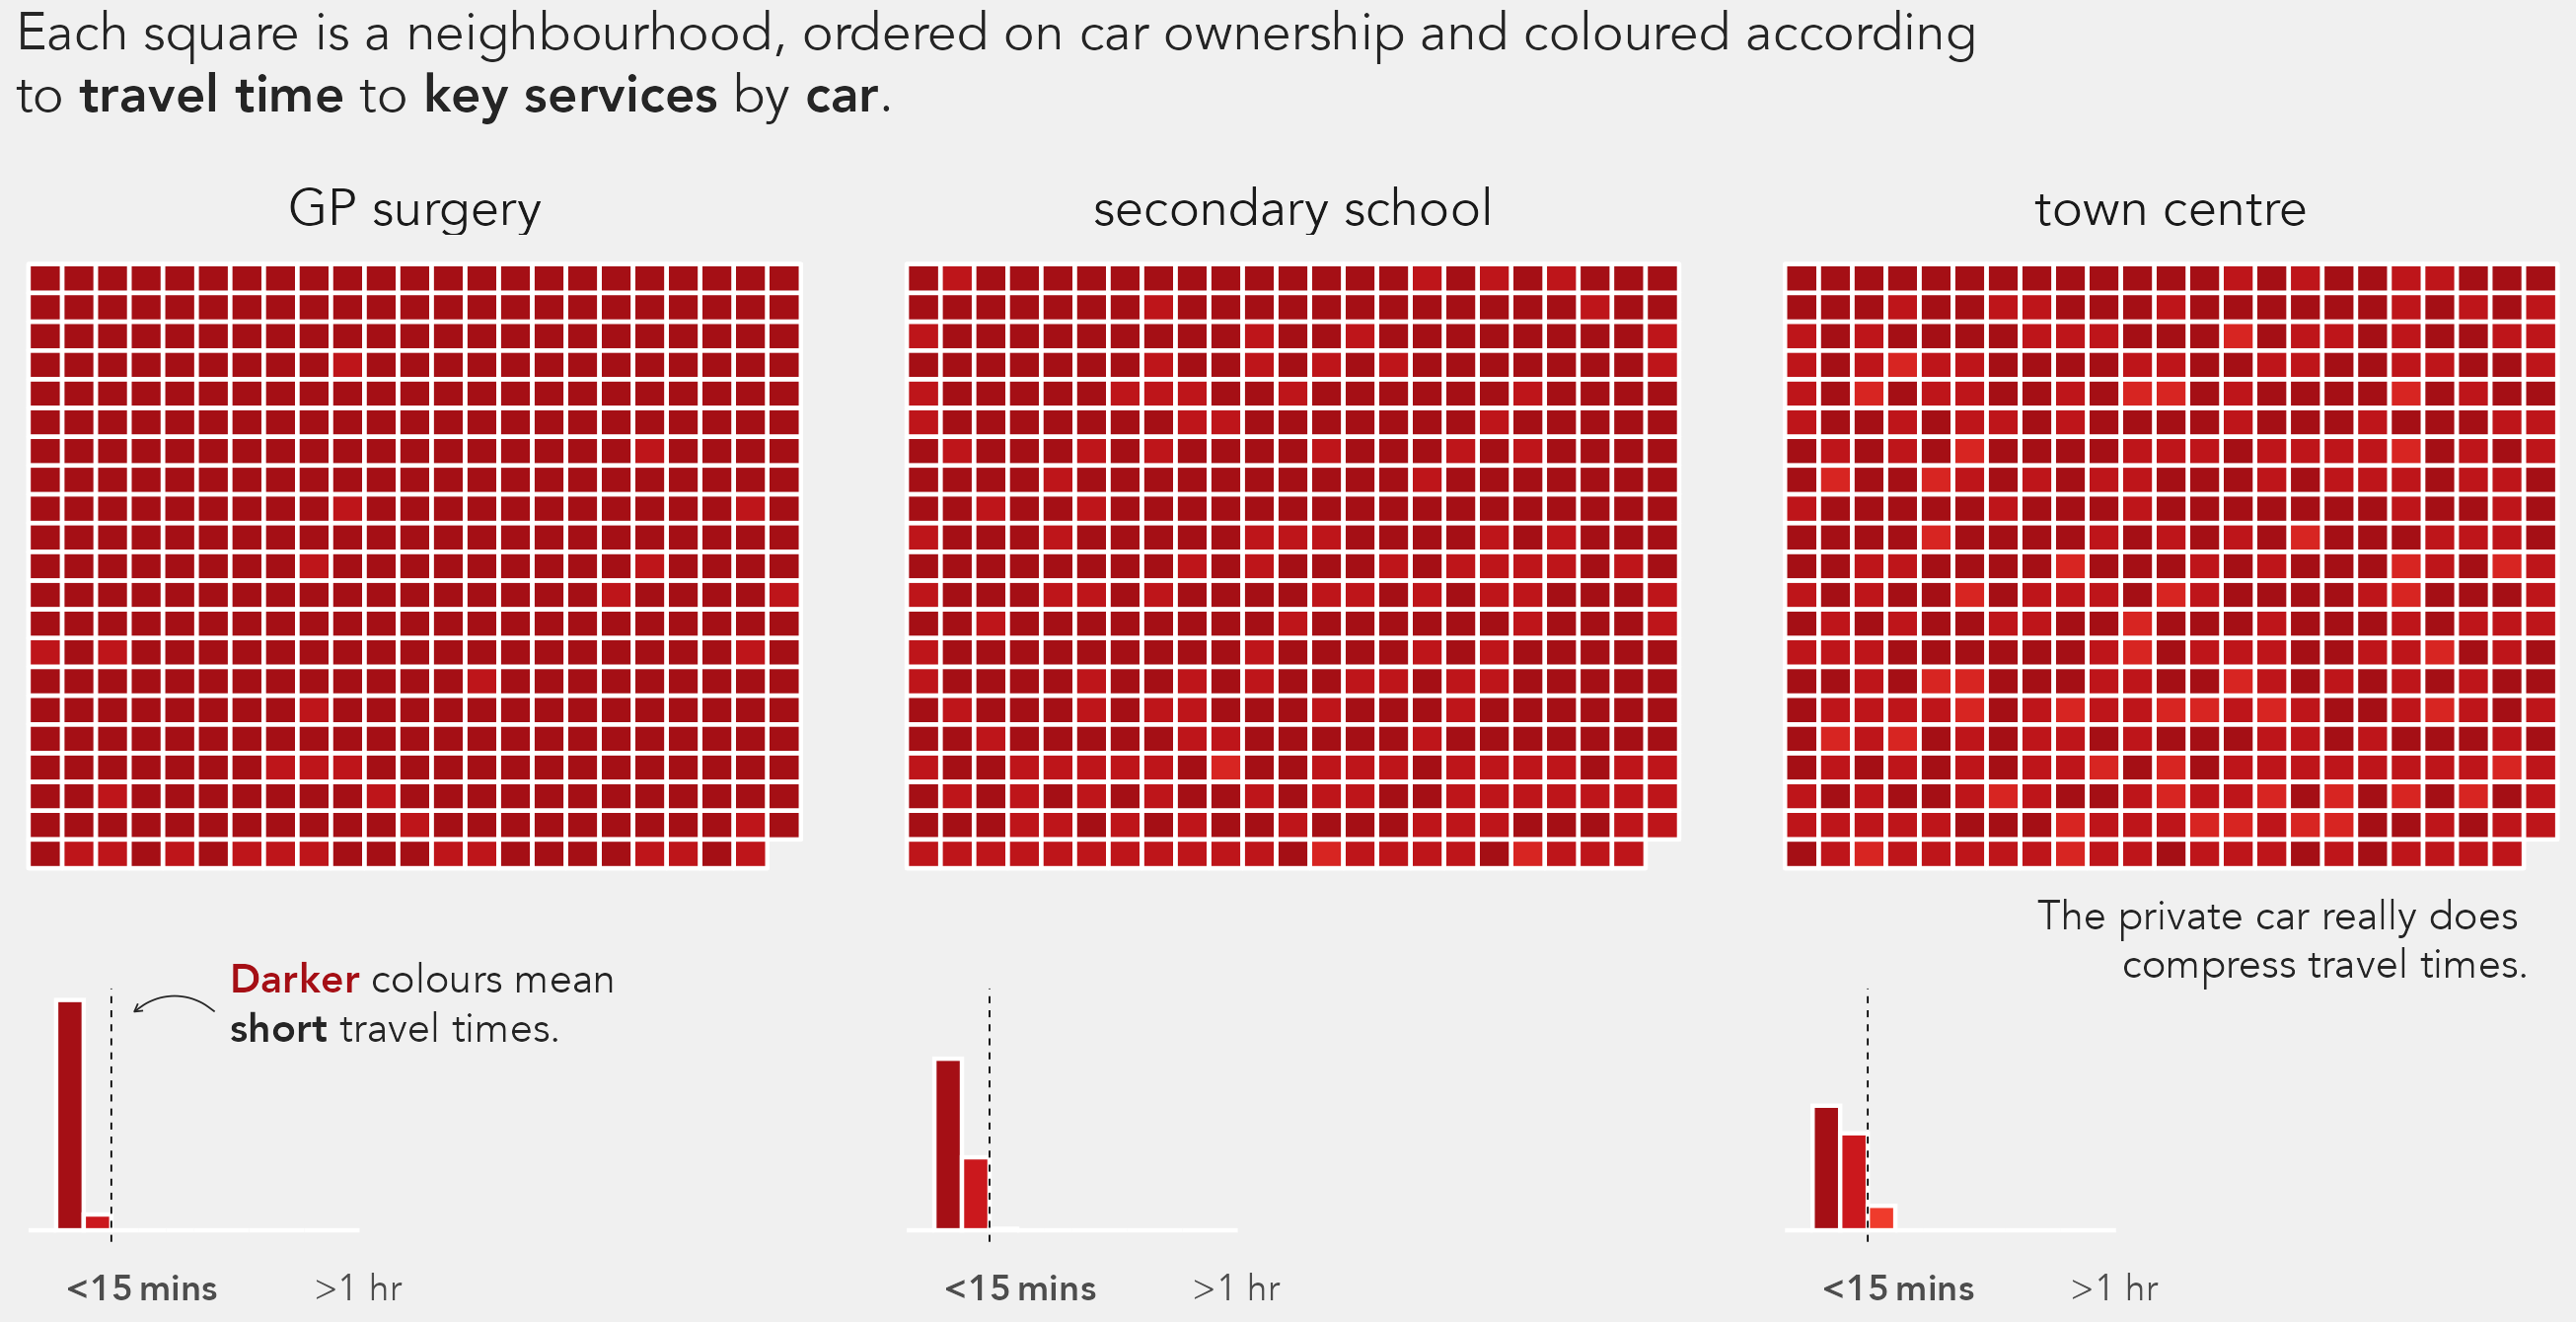
The private car guarantees 15-minute travel for most neighbourhoods
In the first example I colour squares according to average travel time by car to the nearest key activity services – GPs, secondary schools and town centres. Note the squares remain ordered by car ownership. As you might expect, the private car really does compress travel times. Almost every neighbourhood has key facilities accessible in less than a 15-minute journey by car.
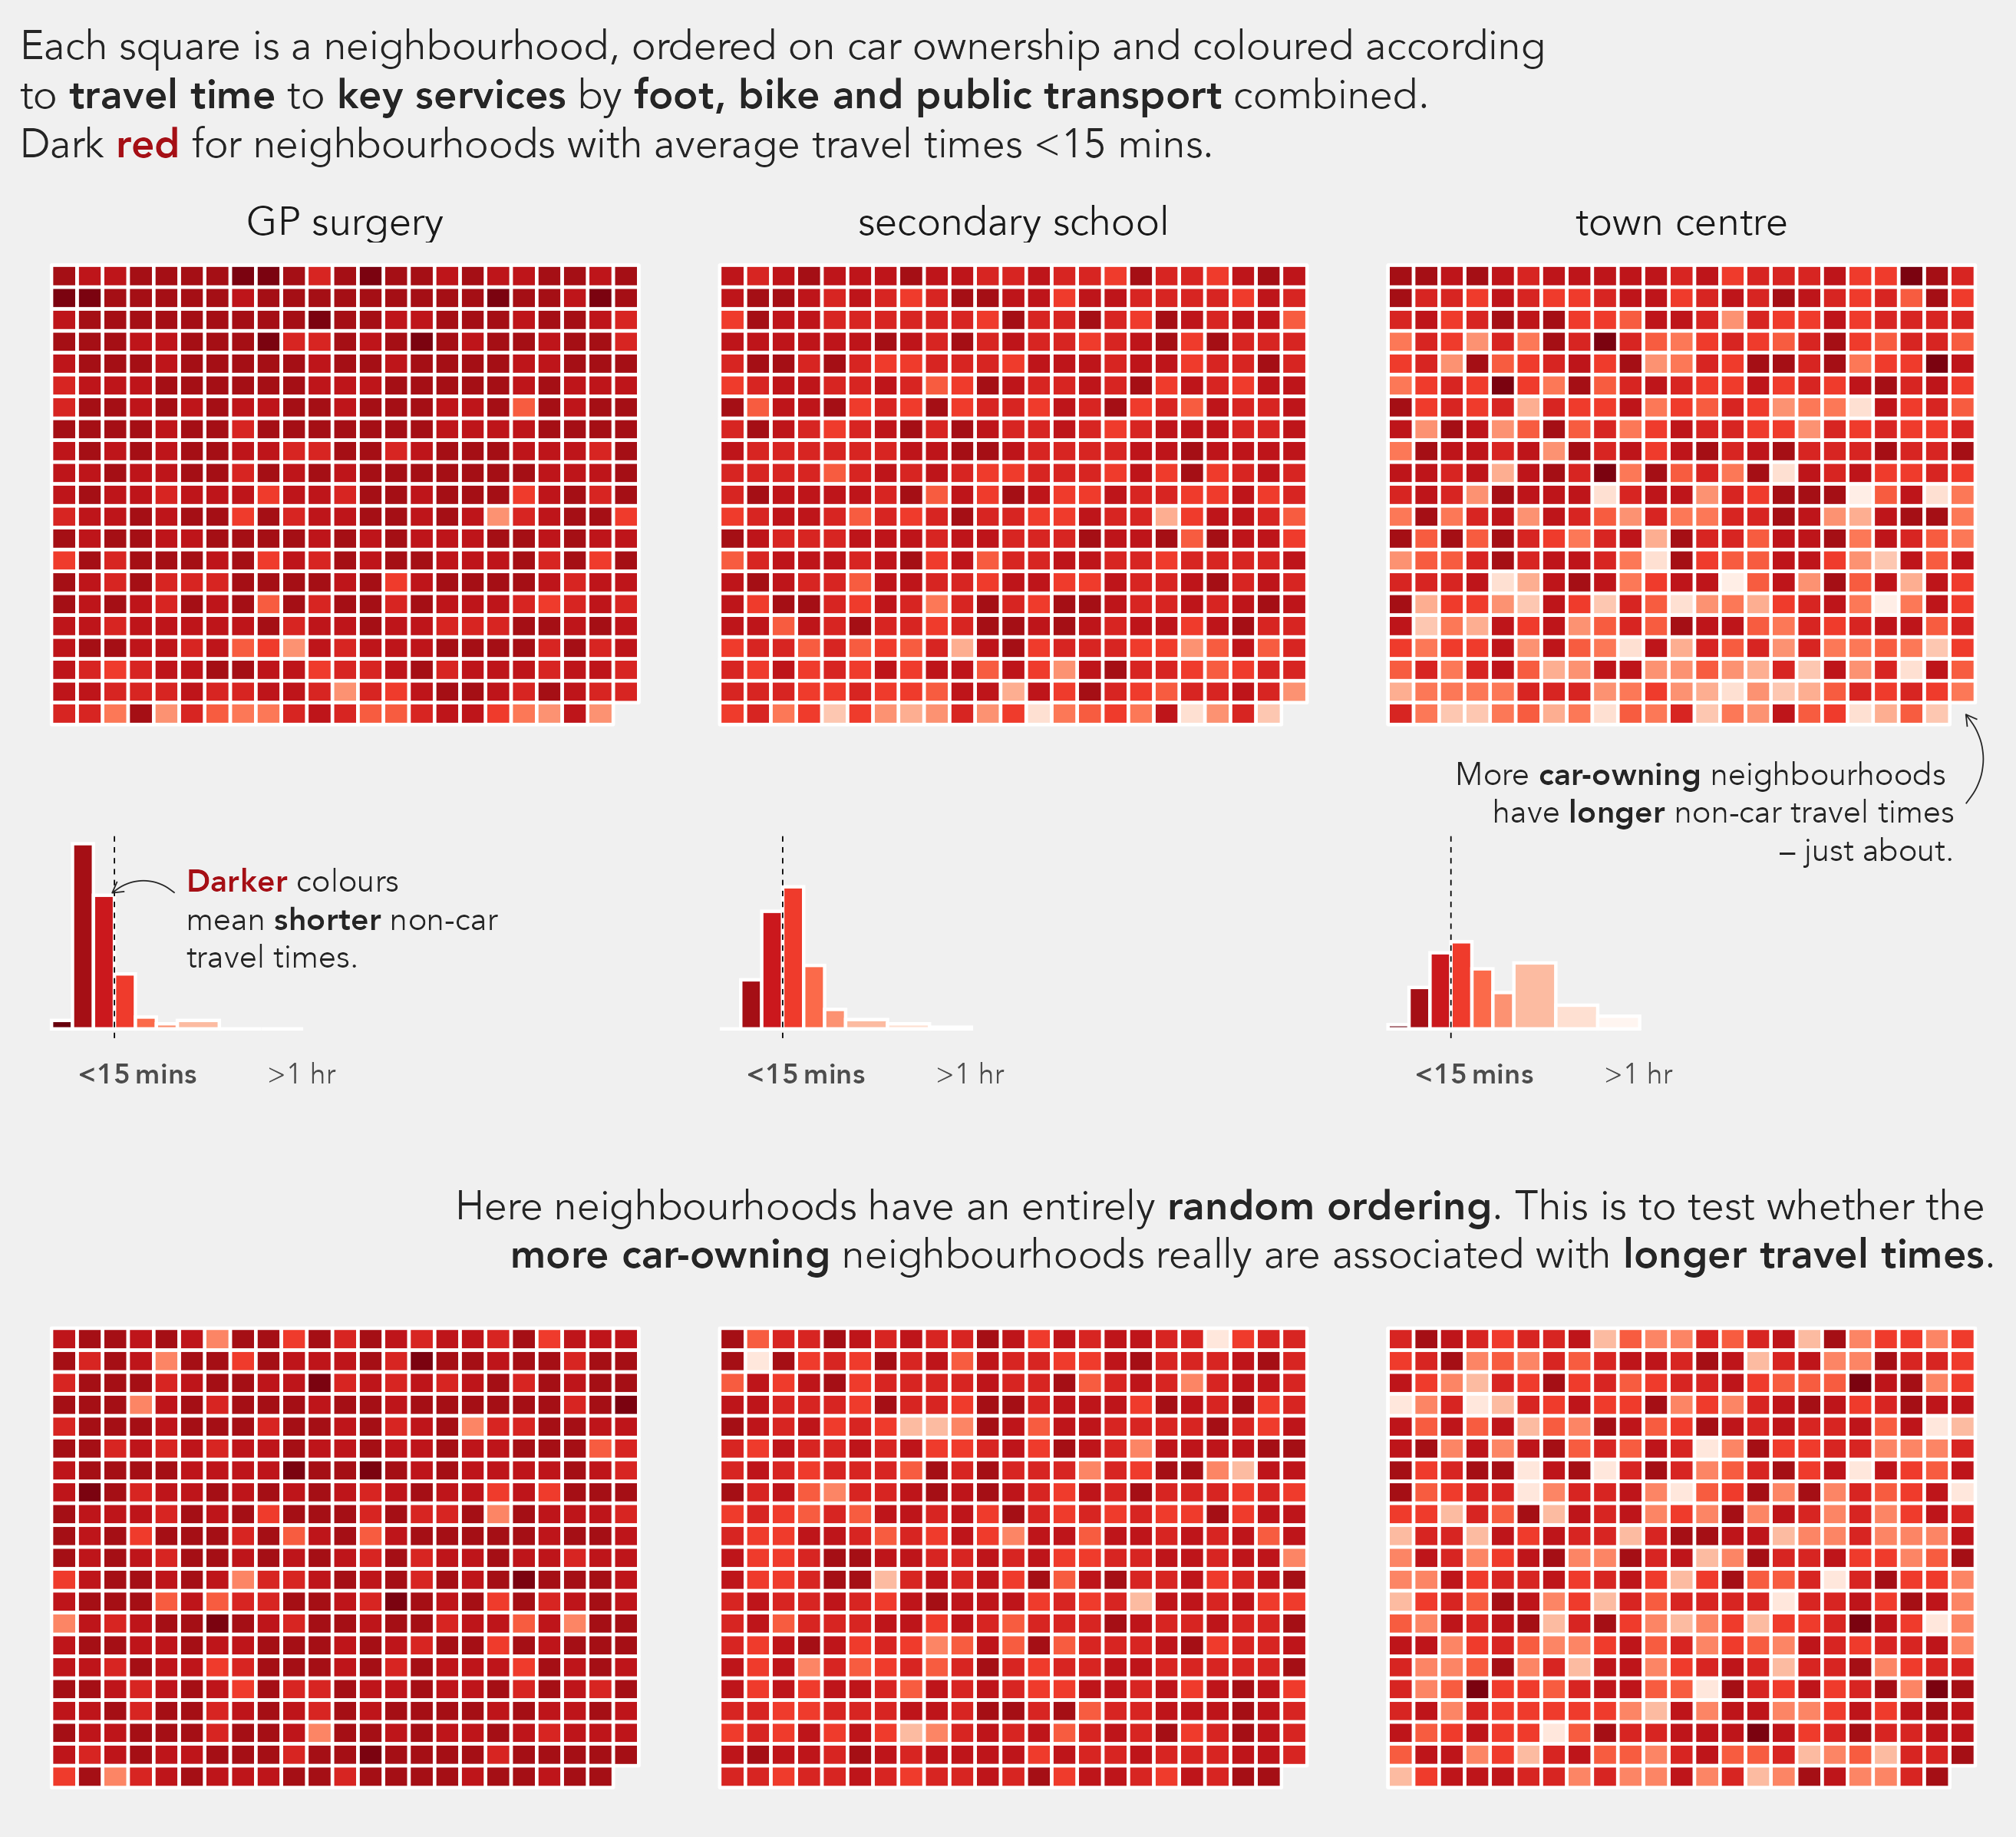
Neighbourhoods with lower car ownership are (sometimes) those with better non-car options
If shifting individuals away from private car use was only about the provision of non-car modes, then we might expect neighbourhoods with the most excess car ownership to be the least well-served by alternatives to the car.
In the graphic below I colour according to the average travel time by foot, bike and public transport combined. From this, it is generally true that neighbourhoods with lower levels of car ownership are, in relative terms, better provided for by car-alternatives – lighter squares (longer travel times) are towards the bottom of the graphics. However, the association between car ownership and non-car accessibility is far from linear. In fact, I had to test that I wasn’t hallucinating this trend of more car intensive neighbourhoods being associated with longer non-car travel times. It does – just about!
Some caveats on a contrived analysis
I mainly collected these data and ran this quick analysis to help plan our Infuze modelling work. There are of course many issues and factors not properly considered and some obvious explanations on why we do not see a clean association between neighbourhood-level car ownership and the relative supply of non-car alternatives, judged by average travel times.
First, car ownership does not straightforwardly imply dependency. A household may choose to own a car, or several cars, for reasons other than necessity. In the 1990s pollsters used car ownership as the proxy for income; and we know that incomes vary systematically across neighbourhoods in Leeds. After income, other factors such as household composition, size, age profile are also likely to explain differences in car ownership – all of which vary by neighbourhood.
Second, our measure of the enabling environment for non-car alternatives – average travel times by foot, bike, public transport – is a reductive one. Taking cycling as an example, average travel times by bike are unlikely to be the key determinant of a neighbourhood’s cycling uptake. We should instead be considering the bikeability of neighbourhoods – for example based on infrastructure and the ‘agreeableness’ of the general cycling environment, which can be estimated using open data (Beecham et al. 2023). Local cultural attitudes and identities also play a large role in shaping cycling behaviour (Aldred and Jungnickel 2014). Quantifying these sorts of attitudes at a neighbourhood-level could be challenging, but is possible using survey-based approaches.
Conclusion
So what does this quick analysis of neighbourhood-level transport stats imply for the modelling work we’re planning through Infuze?
That yes, it will be important to consider how effectively non-car options can meet the everyday travel needs of residents. And clearly it will be hard to ‘beat’ the private car in models that look to optimise on travel time. But the link between car ownership and use and the provision of transport alternatives is non-linear and complex. In addition to incorporating detailed observational data on neighbourhood-level enabling environments for car alternatives, and using survey data to represent a wide set of individual circumstances, we must think carefully about how this context informs behaviour.
This will require theory on the fluidity and stickiness behaviours, and the relative importance of individual circumstances, environmental context (neighbourhood and city-level) and even values and beliefs. As we are modelling future scenarios, we will want to engage with social learning and diffusion that takes place as these circumstances and this context changes. Tricky concepts, but necessary if we are to imagine truly shifting society away from the current status quo – for fundamental, “paradigmatic” change. This understanding is, in any case, our starting point with Infuze.
References
Aldred, Rachel, and Katrina Jungnickel. 2014. “Why Culture Matters for Transport Policy: The Case of Cycling in the UK.” Journal of Transport Geography 34:78–87. https://doi.org/https://doi.org/10.1016/j.jtrangeo.2013.11.004.
Beecham, R., Y. and Yang, C. Tait, and R. Lovelace. 2023. “Connected Bikeability in London: Which Localities Are Better Connected by Bike and Does This Matter?” Environment and Planning B: Urban Analytics and City Science 0 (0): 23998083231165122. https://doi.org/10.1177/23998083231165122.
Citation
BibTeX citation:
@online{beecham2025,
  author = {Beecham, Roger},
  title = {Can We Achieve Transformational Change Through Tweaking the
    Transport System?},
  date = {2025-03-19},
  url = {https://www.roger-beecham.com/blog/2025/03/20/15-min-leeds/},
  doi = {10.59350/hkkjp-exc03},
  langid = {en}
}
For attribution, please cite this work as:
Beecham, Roger. 2025. “Can We Achieve Transformational Change
Through Tweaking the Transport System?” March 19, 2025. https://doi.org/10.59350/hkkjp-exc03.